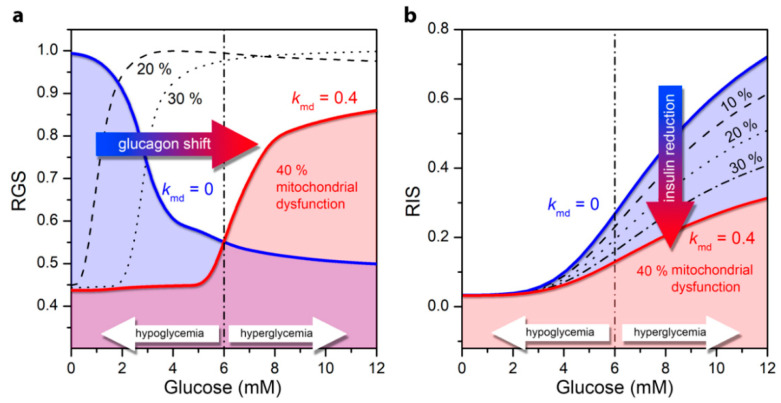
Figure 4.
Relative glucagon and insulin secretion as a function of glucose concentration for normal cell function (blue line) and for the pathological state of T2DM under different levels of mitochondrial dysfunction: 10–40%. (a) Relative secretion of glucagon (RGS) in the alpha cell; (b) Relative insulin secretion (RIS) in the beta cell.

