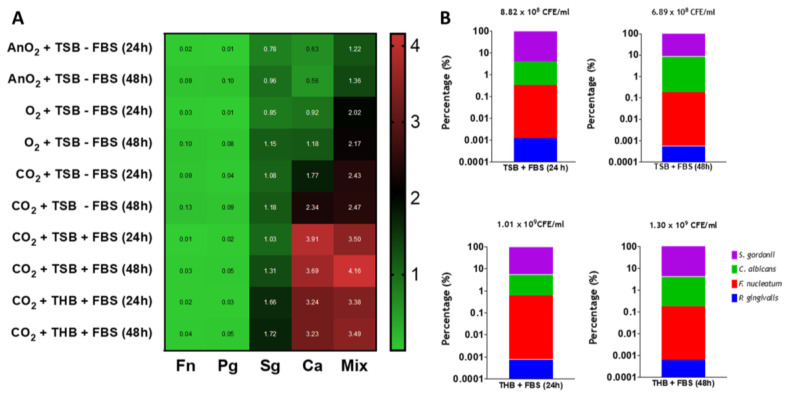
Figure 2.
Biomass and compositional analysis of mono- and multi- species biofilms. (A) Heatmap analyses. Biomass quantification via crystal violet assessment of mono- and multi-species biofilms grown in three different incubation conditions (aerobically, 5% CO2 and anaerobically) in a 1:1 mixture of either RPMI/TSB or RPMI/THB supplemented with 10% FBS for 24 h and 48 h in 24-well flat-bottom plates. Values in heatmap show the mean absorbance reading at 570 nm for all biofilms tested; (B) Compositional analysis of mixed biofilms. The graphs show percentage composition using colony forming equivalents (CFE)/mL of each microorganism in the multispecies biofilms grown in a 1:1 mixture of either RPMI/TSB or RPMI/THB supplemented with 10% FBS, for 24 h and 48 h in 6-well flat-bottom plates, in 5% CO2. Total CFE/mL for all four microorganisms are shown above each bar graph. All experiment are representative of n = 3 from three independent repeats.

