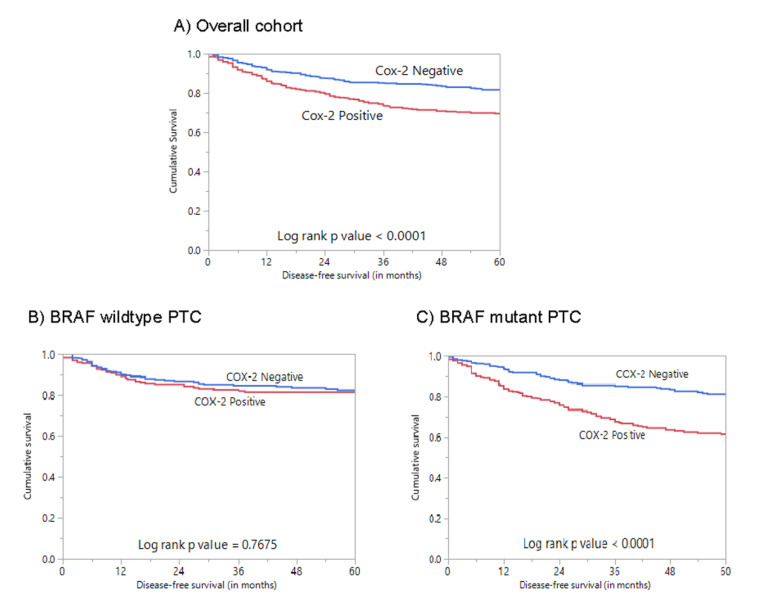
Figure 2.
Survival analyses of COX-2 protein expression in the overall cohort and based on BRAF mutation status. (A) Kaplan–Meier survival plot showing statistically significant poor disease-free survival in COX-2 high-expression cases compared to COX-2 low-expression cases (p < 0.0001); (B) Kaplan–Meier survival plot showing no statistically significant difference in disease-free survival for COX-2 expression in BRAF wild-type PTC (p = 0.7675); (C) Kaplan–Meier survival plot showing statistically significant poor disease-free survival for cases with COX-2 overexpression in BRAF-mutant PTC (p < 0.0001).

