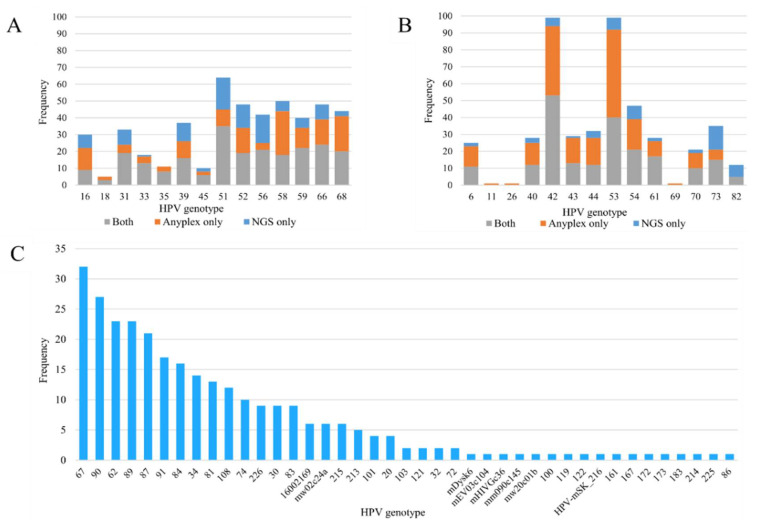
Figure 1.
(A,B) Frequency distribution of human papillomavirus (HPV) genotypes detected by Anyplex II HPV28 and next-generation sequencing: (A) high-risk genotypes, (B) low-risk genotypes. Grey bars indicate genotypes detected by both methods, orange bars indicate genotypes detected by Anyplex II HPV28 only, and blue bars indicate genotypes detected by next-generation sequencing only. (C) Frequency distribution of HPV genotypes detected by next-generation sequencing only.

