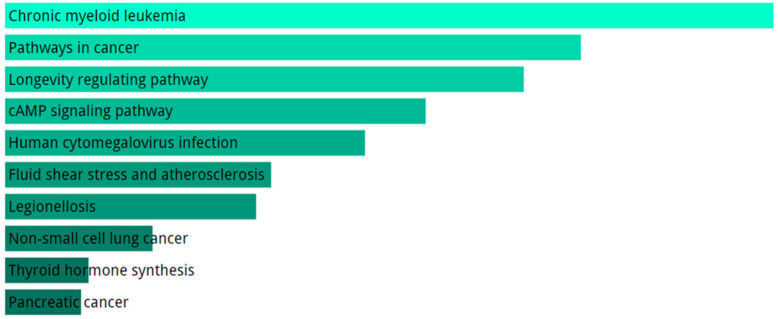
Figure 5.
Analysis of pathways performed with KEGG using DE genes in SALS group compared to healthy controls. We only show top 10 KEGG terms. The significance of the specific gene-set term is represented by the length of the bar. The significance of the term is indicated by the brightness of the bar’s color (the brighter, the more significant).

