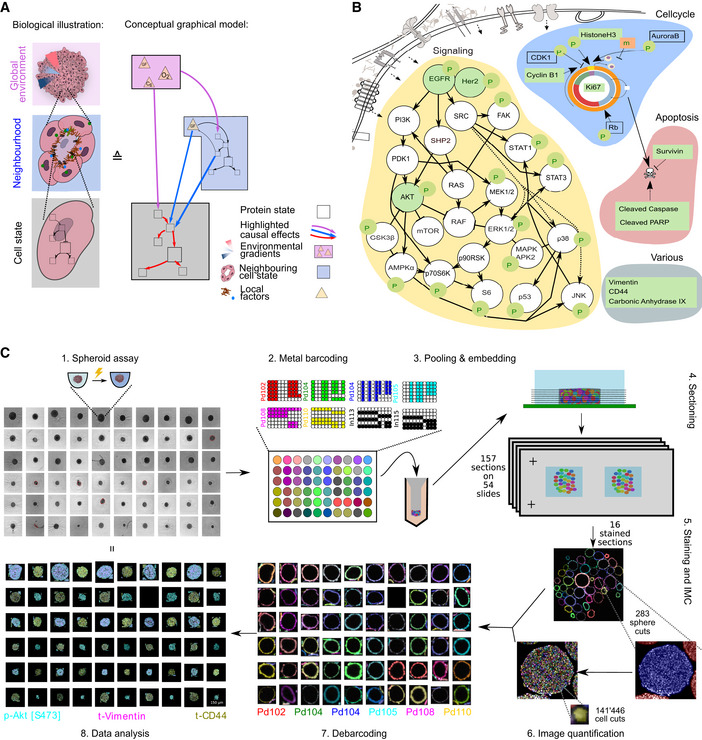
Figure 1. Barcoded IMC assays allow efficient spatial profiling of pooled spheroids.

- Cells sense their environment and compute cellular decisions via a signaling network. Left: Depiction of spheroids at different scales: spheroid with global gradients, for example, of nutrients and oxygen (top), cellular neighborhood (middle), and single cell (bottom). Right: A schematic graphical model highlighting how global environment (pink box), local neighborhood (blue box), and intracellular state (gray box) can determine the levels of a given marker.
- A schematic illustration of the signaling network markers, cell state markers, and other phenotypic markers measured using IMC (green). Nodes depicted in white were not measured.
- Diagram of the approach used for multiplexed IMC analyses of spheroids. The image quantification step involves extraction of information in the form of tabular measurements from images. The data analysis step includes project‐specific, statistical analyses of extracted measurements and their relationships to the different perturbations used.
