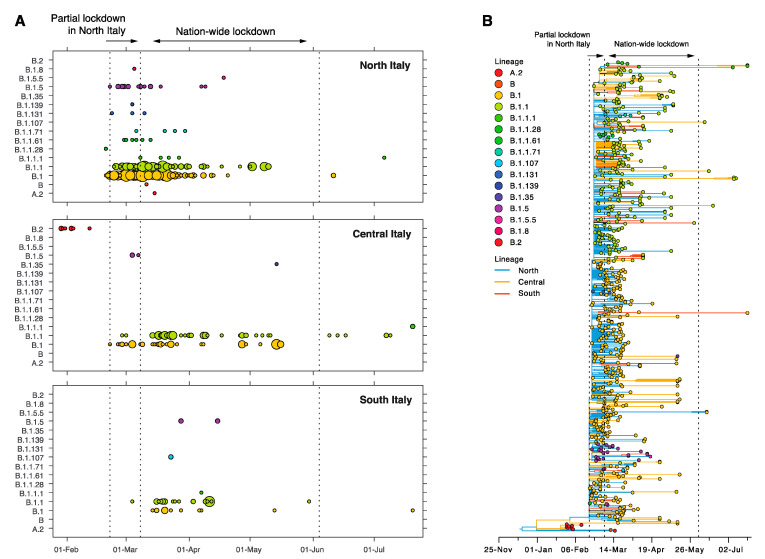
Figure 2.
Distribution of SARS-CoV-2 lineages in Italy. (A) Number of sequences from different lineages across time for the three major geographic regions in Italy. The circle colour corresponds to each lineage and their size is proportional to the number of sequences sampled for a day for each lineage. Smallest circle = 1 sequence, largest circle = 15 sequences. (B) Italian sequences were extracted from a time-scaled tree (the global tree is shown in Figure S1). Branch lengths indicate the number of nucleotide substitutions per site and branches are coloured according to region; blue = North Italy, yellow = Central Italy, red = South Italy. Tip circles are coloured according to lineage.

