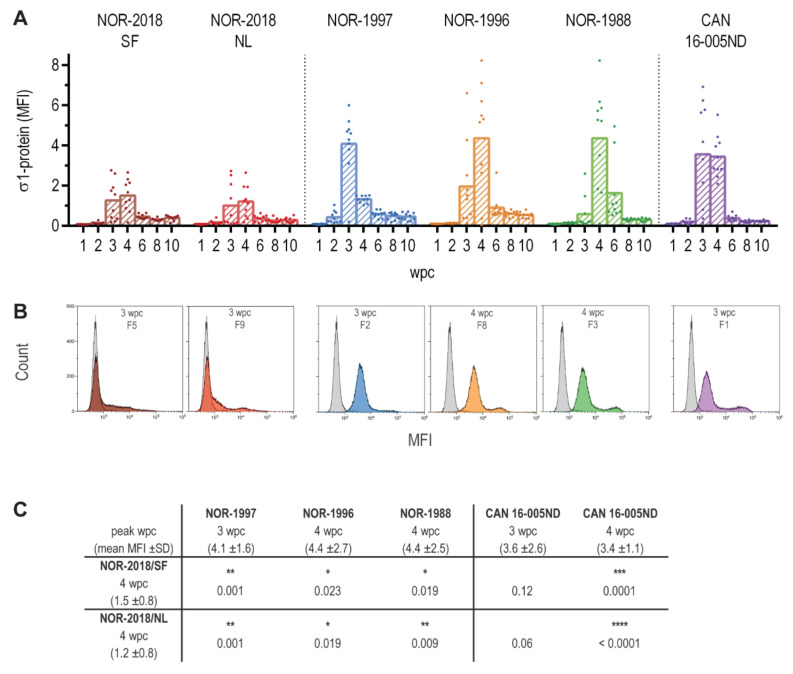
Figure 1.
PRV σ1-protein in blood cells. (A) Amount of σ1-protein in blood cells measured by flow cytometry from 1 to 10 weeks post challenge (wpc), shown as mean fluorescence intensity (MFI) for individual fish and group mean for NOR-2018/SF (dark red), NOR-2018/NL (red), NOR-1997 (blue), NOR-1996 (orange), NOR-1988 (green) and CAN 16-005ND (purple). (B) Histogram from one individual fish at peak of infection from each group, MFI for σ1-protein on X-axis and cell count on y-axis, counting 30,000 cells per sample. Color coding as above, overlaid PRV negative control fish (grey). (C) Statistical analysis comparing mean MFI at peak of infection (mean MFI ± SD shown) for the NOR-2018/SF and NOR-2018/NL, to that of NOR-1997, NOR-1996, NOR-1988 and CAN 16-005ND using Mann-Whitney test, results shown as p-values (* p < 0.05, ** p < 0.01, *** p < 0.001, **** p < 0.0001).

