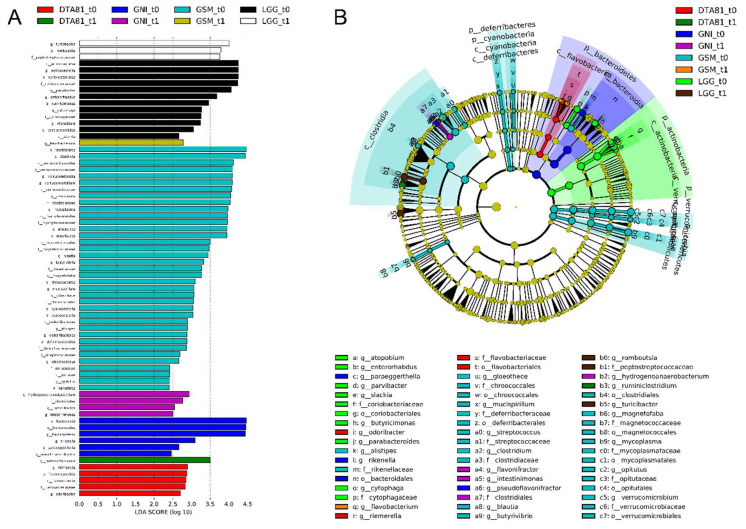
Figure 7.
Linear discriminant analysis effect size (LEfSe) analysis to identify significant differences in abundant taxa (biomarkers) before (t0) and after (t1) the different interventions. (A) Taxonomic groups showing linear discriminant analysis (LDA) scores > 2.0 with false discovery rate (FDR) p < 0.05. Letters: p, phylum; c, class; o, order; f, family; g, genus. (B) Cladogram showing taxa with different abundance among the groups (LDA score > 2.0, FDR p < 0.05). Letters have the same equivalence to those in parentheses in (A).

