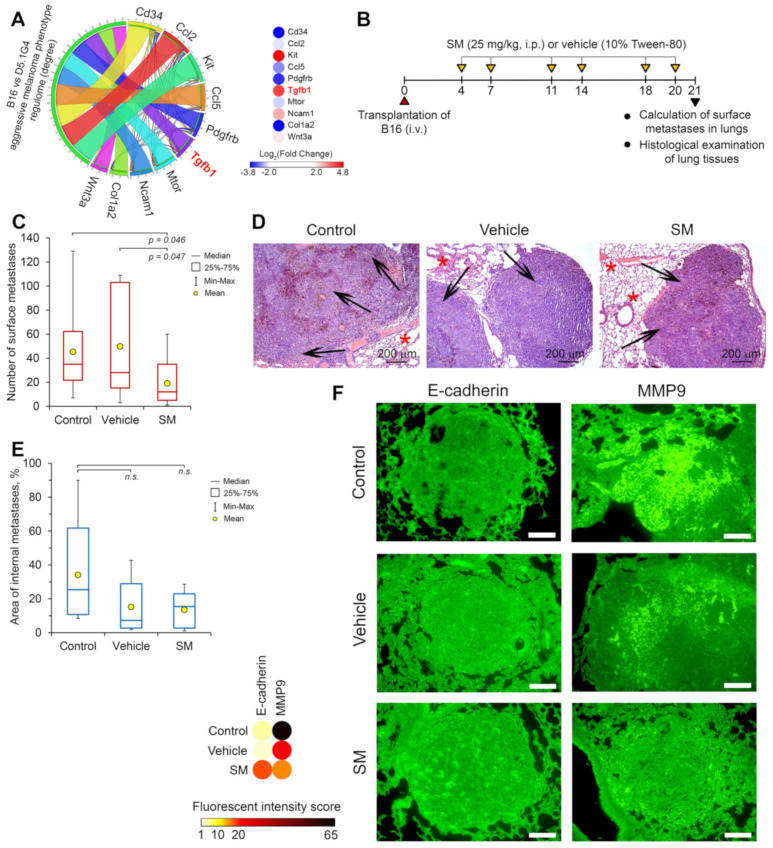
Figure 8.
SM suppresses the metastatic growth of B16 melanoma in vivo. (A) TGF-β plays a key role in regulation of high tumorigenicity of B16 melanoma cells. The whole genome expression profiles of highly aggressive B16 and poorly tumorigenic D5.1G4 murine melanoma cells were compared by re-analysis of GSE69908 dataset using GEO2R tool. The left panel shows the top 10 master regulators, which control the growth and metastasis of B16 melanoma and are the most associated with analyzed regulome. Degree—the number of interconnections between master regulators and neighbors in gene regulatory network reconstructed from obtained differentially expressed genes (|Log2(Fold Change)|>2, p < 0.05) using the Search Tool for the Retrieval of Interacting Genes (STRING) database. The right panel shows the changing of expression of revealed master regulators between B16 and D5.1G4 cells (red and blue represent up- and down-regulation, respectively). (B) The scheme of the animal study. (C) The number of surface metastases in the lungs of B16 melanoma-bearing mice. (D,E) Histological images (D) and areas of internal metastases (E) of B16 melanoma in the lungs of tumor-bearing mice without treatment and after SM or vehicle administration. Hematoxylin and eosin staining. Original magnification ×100. The black arrows and red asterisks indicate lung metastasis foci and normal lung tissue, respectively. (F) SM suppresses the expression of EMT-associated markers on the model of B16 melanoma in vivo. Representative images of immunohistochemical staining of lung metastases with anti-E-cadherin and anti-MMP9 primary antibodies with subsequent incubation with secondary Alexa Fluor® 488-conjugated antibodies. Scale bar corresponds to magnification ×200. The intensity of green fluorescence, corresponding to the expression of E-cadherin and MMP-9, was calculated according to the formula (2) for each image after subtraction of background using ImageJ software and visualized as a heatmap using Morpheus tool.

