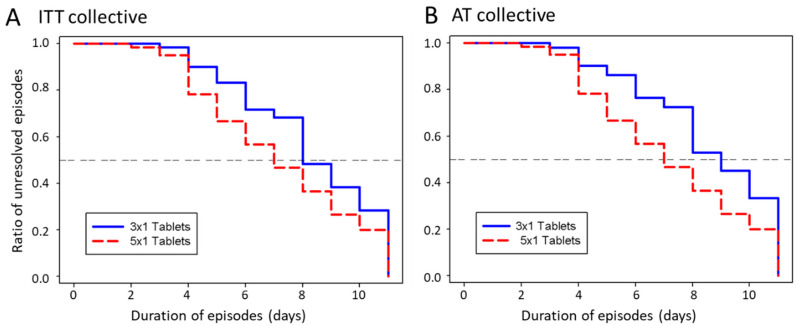
Figure 3.
Kaplan–Meier estimate curves of the ratio of unresolved episodes per Echinaforce Junior Tablets (EFJ)-treatment day in the “intention-to-treat” (ITT) collective (A), and in the “as-treated” collective (B). The curves of high dosage group is indicated in red dashed lines and the curves of the low dosage group indicated in blue solid lines. The high-dose group in the “as-treated” collective includes five patients who were originally allocated to the low-dose group but who showed >160% EFJ consumption.

