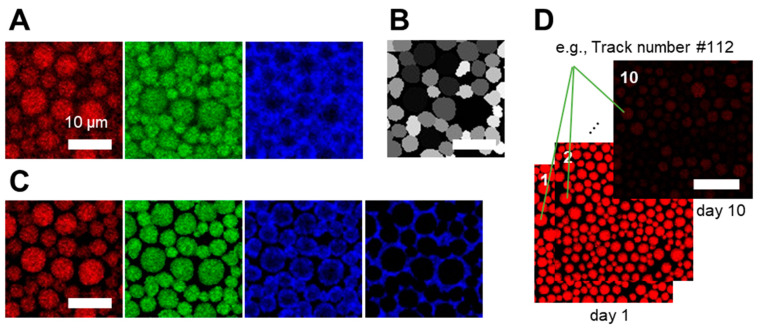
Figure 2.
Workflow for the segmentation and tracking of individual oil droplets. (A) Original images (raw data) were collected in three separate channels (red, green, and blue). (B) Droplets were segmented using StarDist. (C) Segmented images were reconstructed by applying the segmentation mask (StarDist) to the original images. The blue channel images represent intensity within and outside the mask corresponding to oxidized proteins at the interface and in the continuous phase. (D) Segmented images that have clear borders were stacked together for tracking. Each droplet was tracked using Trackmate for up to 10 days. Tracking numbers were allocated to individual droplets. Scale bars represent 10 µm in (A–D).

