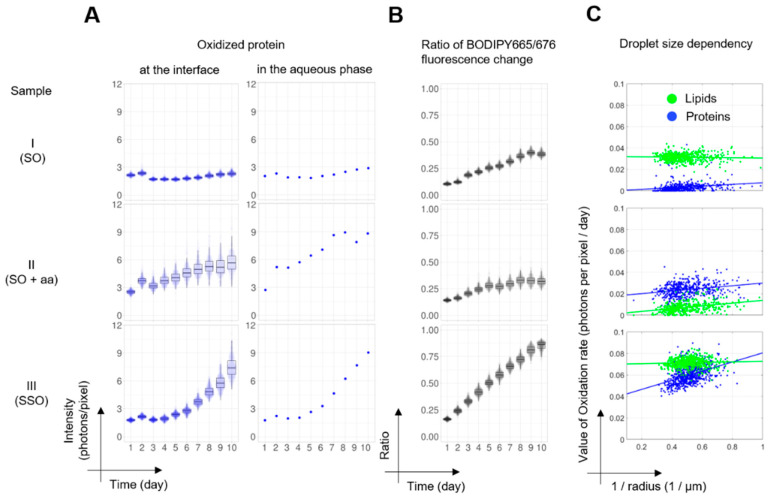
Figure 3.
Statistical analyses of protein and lipid oxidation. (A,B) The data are visualized using PlotsOfData [33]. Each data point represents the average intensity of individual droplets. Black boxes indicate the 95% confidence interval (95CIs) of the data and the center line indicates the median value. (A) Intensity changes of protein oxidation at the interface and the aqueous phase. For the numbers of analyzed droplets (left column), see Table 2; for the aqueous phase (right column), we obtained a single number from the entire field of view. (B) The ratio of BODIPY 665/676 fluorescence intensity changes is presented as a measure of lipid oxidation. The averaged intensity per droplet from λex561 nm (oxidized lipids) was divided by the sum intensity from λex640 nm (non-oxidized lipids) and λex561 nm (oxidized lipids). (C) The effect of the inverse droplet size (surface to volume) on the oxidation rate of lipid within droplets (green color) and protein at/near interfaces (blue color) based on changes in fluorescence intensity. Dots show the local lipid oxidation rate as obtained from fitting the time dependency of BODIPY 665/676 color shifts and protein fluorescence changes in individual droplets with the Gompertz function. Lines show the regression analysis result of local lipid (green line) and protein (blue line) oxidation rates on the inverse of droplet sizes (see Supplementary Materials Tables S3–S5).

