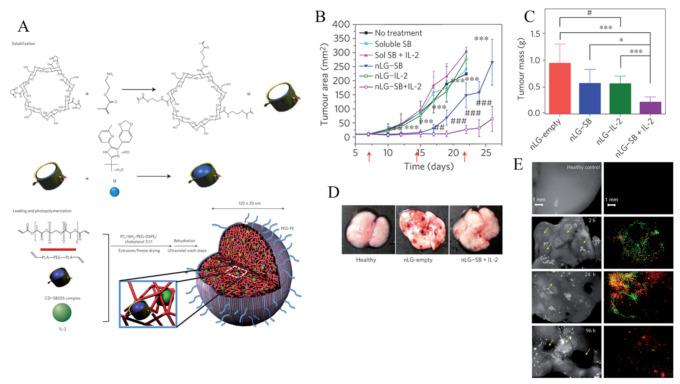
Figure 4.
(A) The synthesis approach of the liposomal polymeric gel (nLG) particle system. (B) Plot of tumor area versus time. Red arrows indicate treatments (via intratumoral injection). (p < 0.05, *, p < 0.001, ***, By ANOVA with Turkey’s multiple comparison test. p < 0.05, #, by two-tailed t-test. (C) Tumor masses vs nLG-treated groups, p < 0.001, ***, p < 0.01, **, p < 0.05, *, By ANOVA using Turkey’s post-test. (D) Images of lung immediately before collection of lung-infiltrating lymphocytes from mice, (E) Uptake of lipid carrier (green) and rhodamine payload (red) around individual lung tumors at 2 h post injection. Reproduced with permission from [107]. Copyright 2012, Nature Publishing Group.

