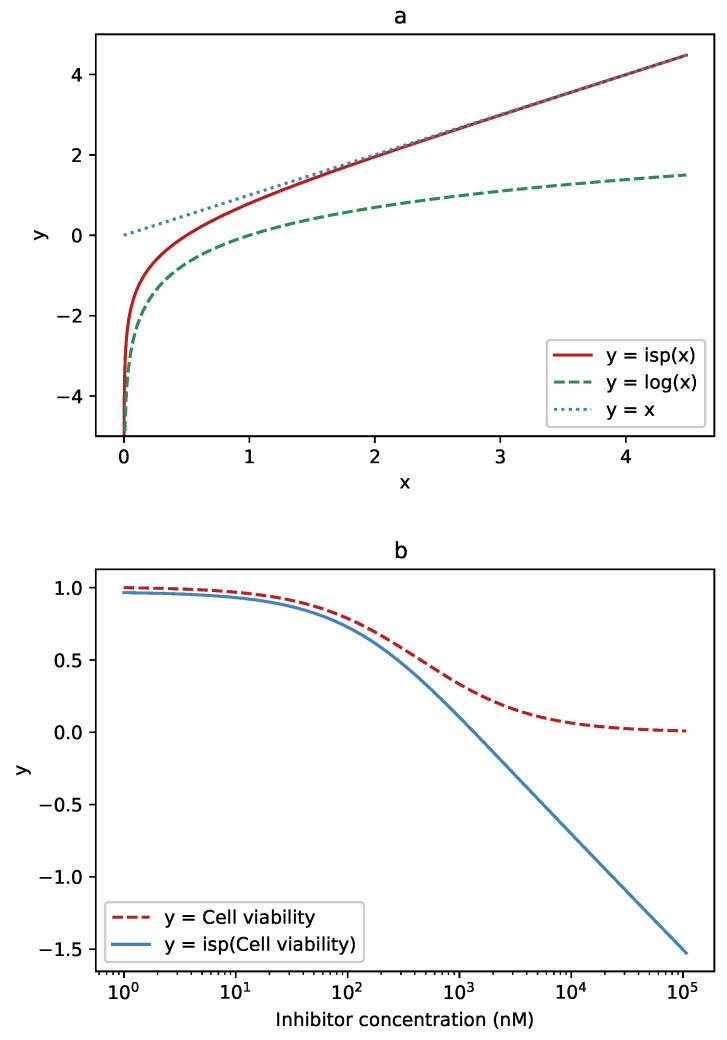
Figure 2.
The function used to transform the data and its effect on the Hill curve: (a) For low values, close to zero, the inverse softplus function (solid, red) approximates the logarithm (dashed, green). For high values, it approaches the identity line, (dotted, blue). (b) Where the logistic (Hill) function (dashed, red) has high values, the inverse softplus (solid, blue) leaves it almost unchanged. At low values, where the logistic function becomes close to a falling exponential, the inverse softplus transforms it to an almost straight line.

