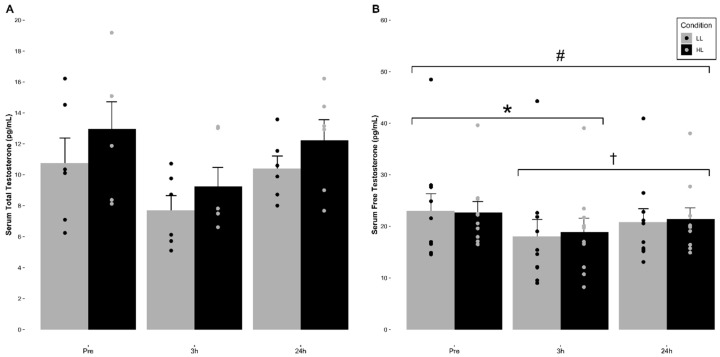
Figure 1.
Mean (±SE) and individual changes in serum (A) total testosterone and (B) free testosterone concentrations in response to volume- and intensity-equated low- and high-load resistance exercise. (A): There were no significant changes over time, between conditions, or significant interactions observed (p > 0.05). (B): * Indicates a significant decrease at 3 h post-exercise compared to pre-exercise values in both conditions (p < 0.05). # Indicates a significant decrease at 24 h post-exercise compared to pre-exercise values in both conditions (p < 0.05). † Indicates 24 h post-exercise was significantly greater than 3 h post-exercise values in both conditions (p < 0.05).

