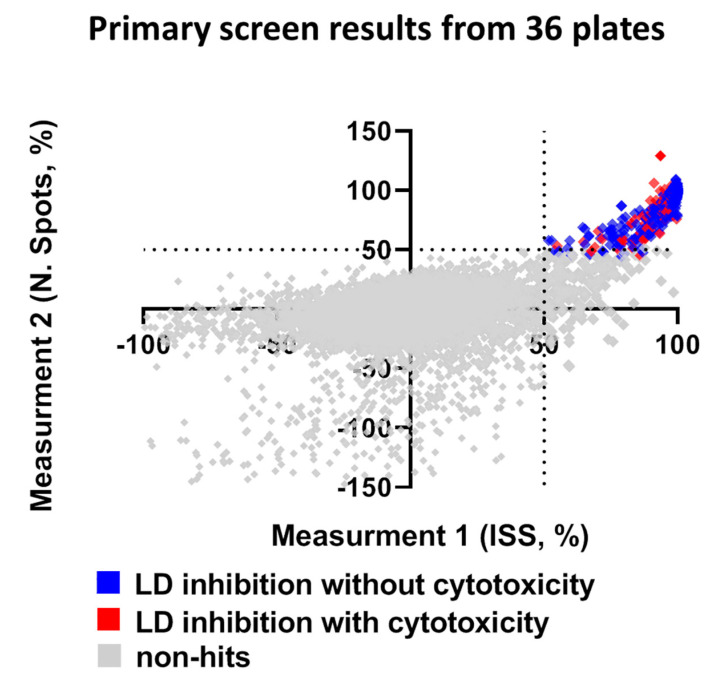
Figure 4.
Summary of library screen and hit confirmation. The scatter plot for ISS versus number of spots after normalization in non-treated hiPSC-Hep indicates wells with no effect (grey squares), hits as ≥ 50% ISS and N. Spots and >60% valid cell count (blue squares) and cytotoxic as ≤40% valid cell count (red squares). Each dot represents the mean of six fields from one well treated with one compound from the library.

