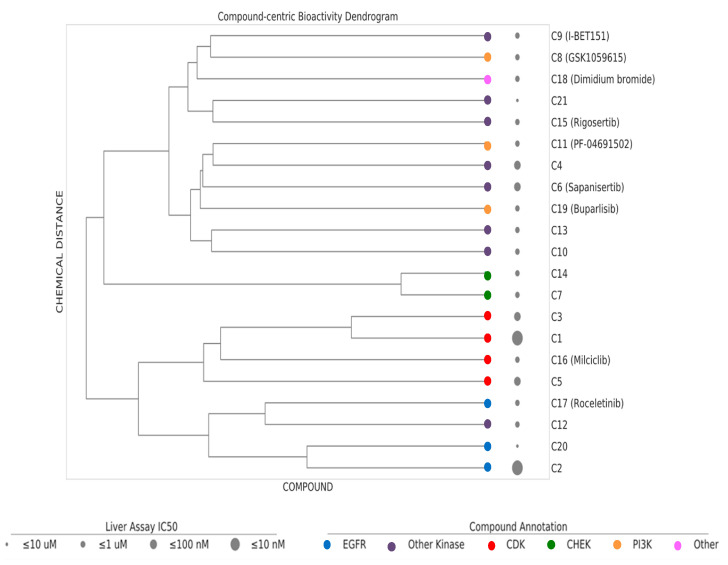
Figure 5.
Dendrogram–hierarchical clustering depicts the hierarchical Ward’s clustering of 21 compounds using extended connectivity fingerprints with radius 4 (ECFP4). The compound nodes are colored based on their MoA (color coding). The drug panel of 21 compounds are shown as circles of increasing size proportional to the IC50 bioactivity in the hiPSC-Hep assay.

