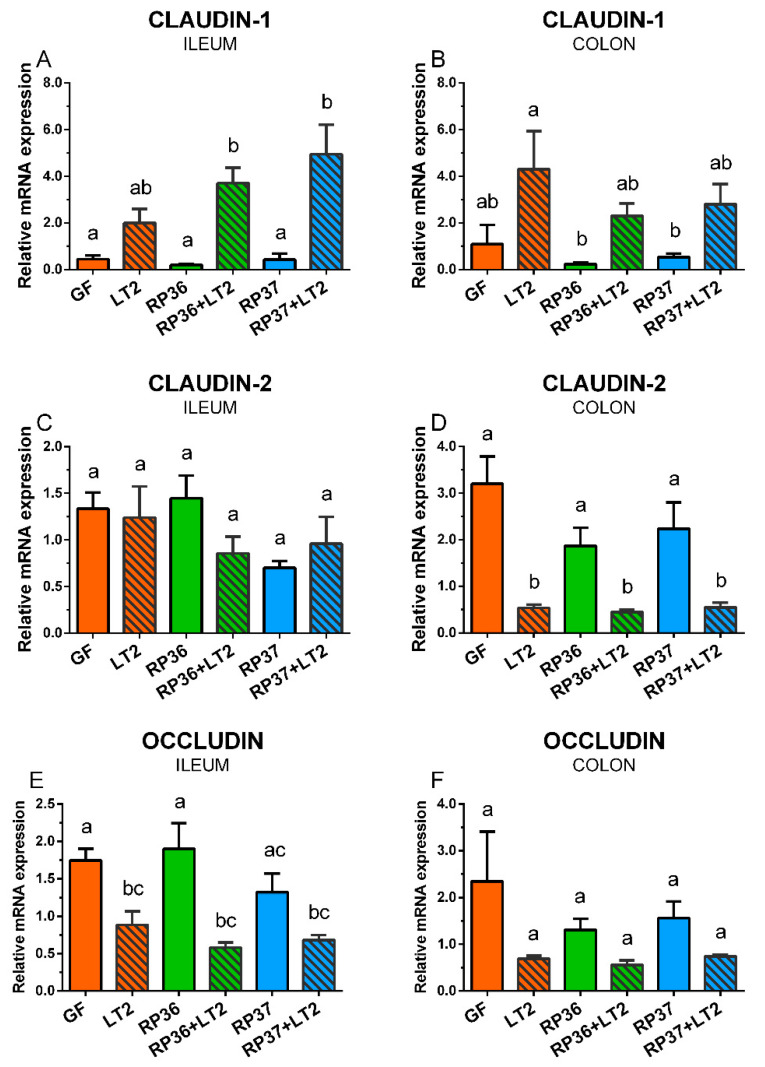
Figure 7.
Expression of claudin-1 (A,B), claudin-2 (C,D), and occludin (E,F) mRNA in the ileum (A,C,E) and colon (B,D,F) of the gnotobiotic piglets: Germ-free (GF), infected with S. Typhimurium LT2 (LT2), colonized with B. boum RP36 (RP36), colonized with RP36 and infected with LT2 (RP36+LT2), colonized with B. boum RP37 (RP37), and colonized with RP37 and infected with LT2 (RP37+LT2). The values are presented as mean + SEM. Statistical differences were calculated by one-way ANOVA with Tukey’s multiple comparison post-hoc test, and p-values < 0.05 are denoted with different letters above the columns. Six samples in each group were analyzed.

