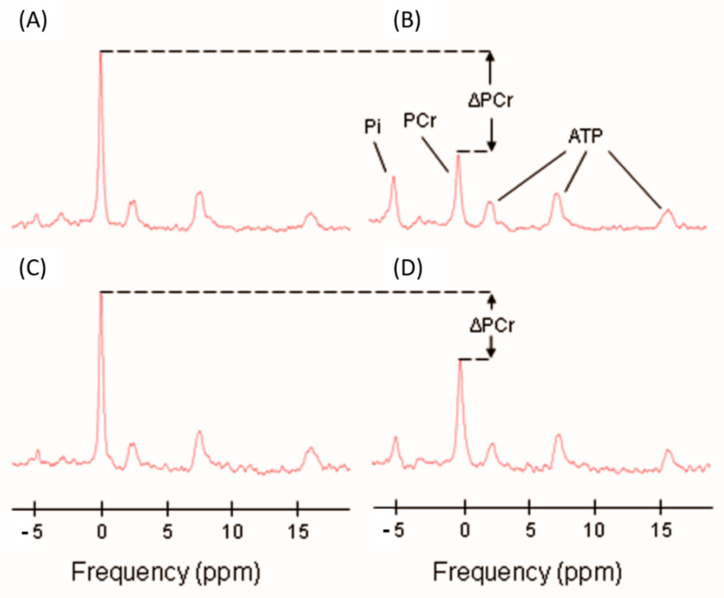
Figure 3.
Representative 31P spectra with inorganic phosphate (Pi), phosphocreatine (PCr), and ATP resonances indicated in panel (B). Panels (A,B) show examples of baseline and postexercise spectra of a typical level of exercise induced PCr depletion (ΔPCr). Panels (C,D) represent examples of baseline and postexercise spectra with a minimally acceptable level of PCr depletion (ΔPCr = 33%) [7].

