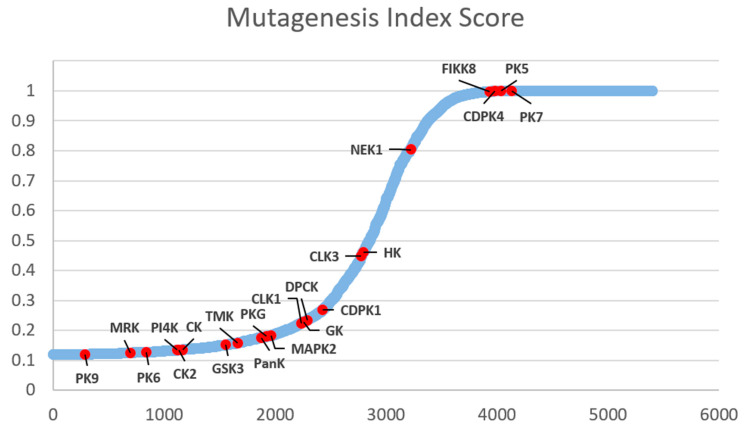
Figure 31.
Mutagenesis Index Score graph with protein kinases described in the review highlighted. All P. falciparum genes were ordered from the lowest to the highest score and then attributed an arbitrary rank number to obtain this curve. Data from Zhang et al. [124].

