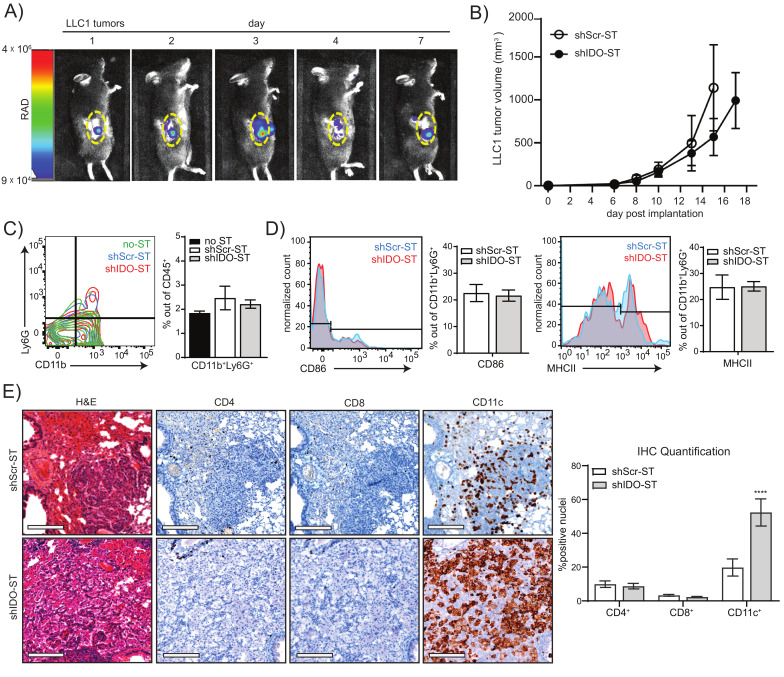
Figure 2.
Colonization, tumor growth, and immune cell phenotypes after sub-therapeutic shIDO-ST treatment. (A) Mice were implanted with LLC1 tumor cells subcutaneously and allowed to grow to an average volume of 200 mm3. 1 × 10⁶ cfu of ST carrying a bacterial luciferase (LUX-ST) was injected intravenously and mice were imaged for bioluminescent signal on days 1, 2, 3, 4, and 7 post ST administration. Bioluminescent signal is shown in rainbow corresponding to radiance (RAD). Yellow dotted line borders the tumor. (B) Six days after implantation of LLC1 cells into mice, mice were treated with three consecutive, daily doses of 1 × 10⁶ cfu shScr or shIDO-ST. Tumor volumes were measured three times weekly until maximum allowed tumor growth was reached. n = 4 mice per group. (C) Flow cytometry of neutrophil frequency (CD11b+Ly6G+) out of total CD45+ cells from tumors treated with HBSS (no-ST), shScr-ST or shIDO-ST. Tumors were processed 48 h after the third treatment. Bar graph shows quantification of flow cytometry results. (D) Flow cytometry of antigen presentation molecules on neutrophils (CD86+ or MHCII+ out of CD11b+Ly6G+ cells). Bar graph shows quantification of flow cytometry results. (E) KP mice with lung tumors arising from oncogenic transformation were treated with 1 × 10⁶ cfu of shScr-ST or shIDO-ST. Twenty-four hours after treatment with ST, mice were euthanized and lungs were removed and fixed for H&E and IHC staining (using CD4, CD8 and CD11c antibodies). Representative images shown, scale bar = 75 µm. DAB staining for each antibody was quantified out of total hematoxylin stained nuclei for each antibody (5–12 areas per lung). Quantifications are shown as bar graphs. **** p < 0.0001.

