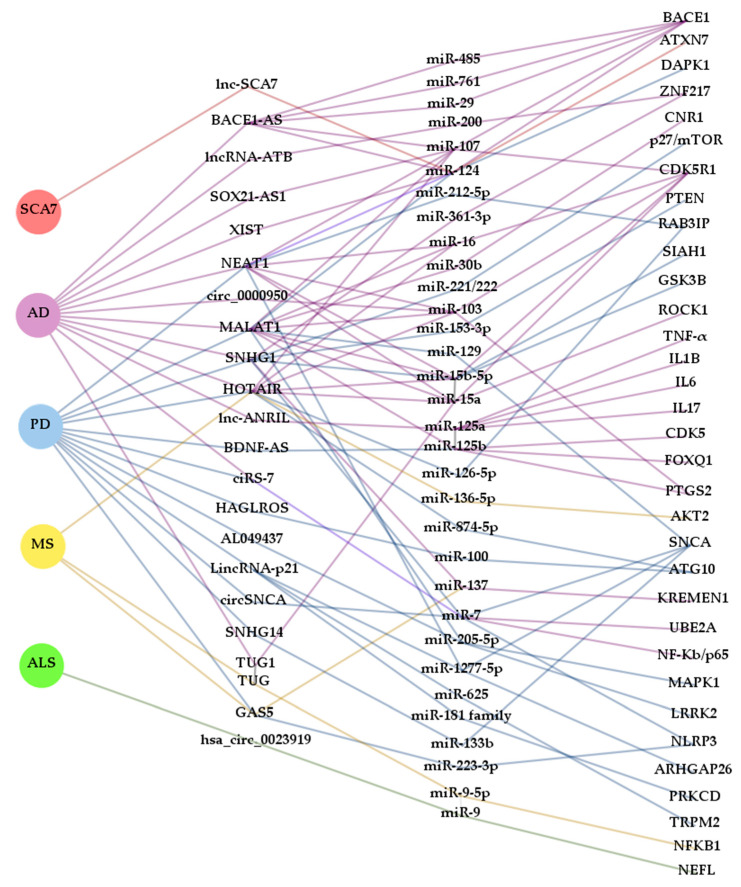
Figure 3.
Complexity and interaction of ceRNETs in NDDs. The diagram was constructed with Gephi software from ceRNAs (lncRNAs and circRNAs) that, according to the bibliography cited in this review, contribute to the pathogenesis of more than one neurodegenerative disease and miRNAs that are part of ceRNETs from more than one ceRNA. Interactions between RNA molecules are represented with lines colored in accordance with the NDD background they have been described in: spinocerebellar ataxia type 7 (SCA7) (red), Alzheimer’s disease (AD) (purple), Parkinson’s disease (PD) (blue), multiple sclerosis (MS) (yellow) and amyotrophic lateral sclerosis (ALS) (green).

