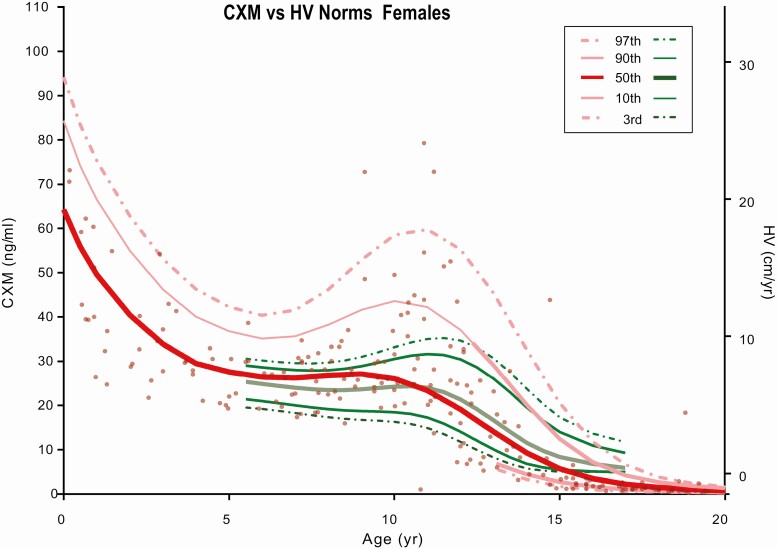
Figure 2.
Collagen X biomarker (CXM) values by age for females. CXM percentile reference curves from the third to 97th percentiles for females generated using LMS analysis. Green curves are standard height velocity (HV) curves from the third to 97th percentiles taken from Kelly et al (7). HV vs CXM ng/mL equivalent levels were added as a right y-axis according to the data Fig. 4B from this manuscript.

