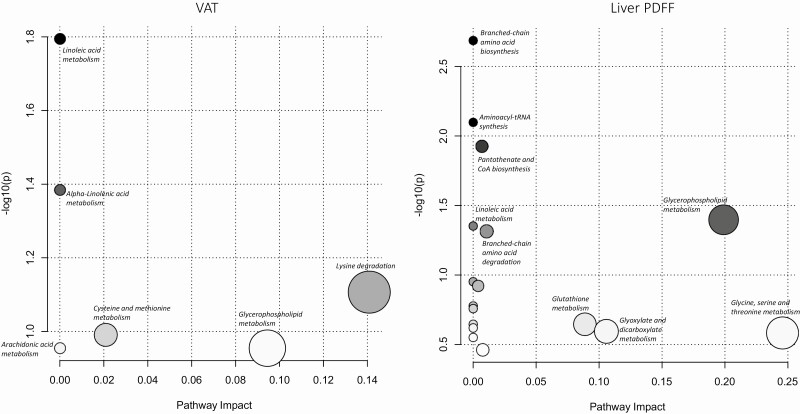
Figure 2.
Metabolic pathways significantly associated with both visceral adipose tissue (VAT) volume and liver proton density fat fraction (PDFF). The metabolites are arranged according to the scores based on enrichment analysis (y-axis) and topology analysis (x-axis). The color and size of each circle are based on P-values and pathway impact values, respectively.

