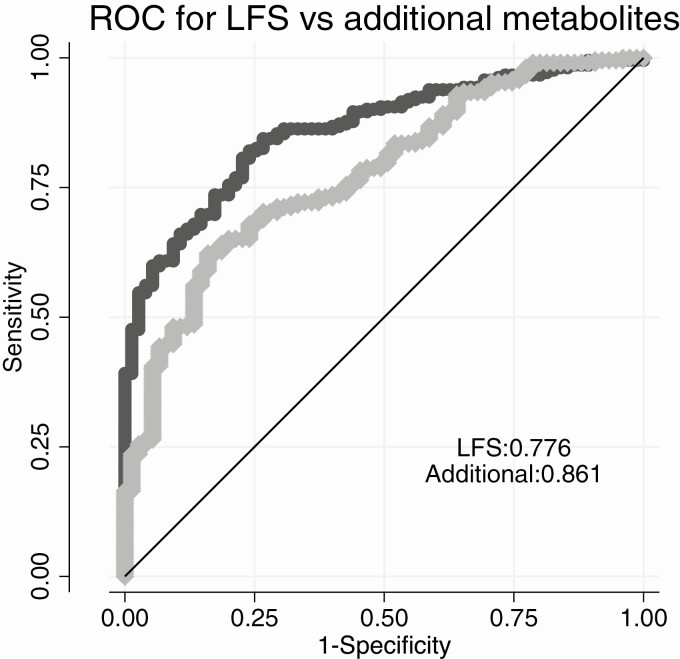
Figure 3.
Area under the curve (AUC) for the liver fatty score (LFS) alone (light grey) and when 3 metabolites were added (1-palmitoyl-2-palmitoleoyl-GPC (16:0/16:1), behenoyl dihydrosphingomyelin (d18:0/22:0) and betaine) (dark grey) regarding discrimination of nonalcoholic fatty liver disease (NAFLD) in the sample.

