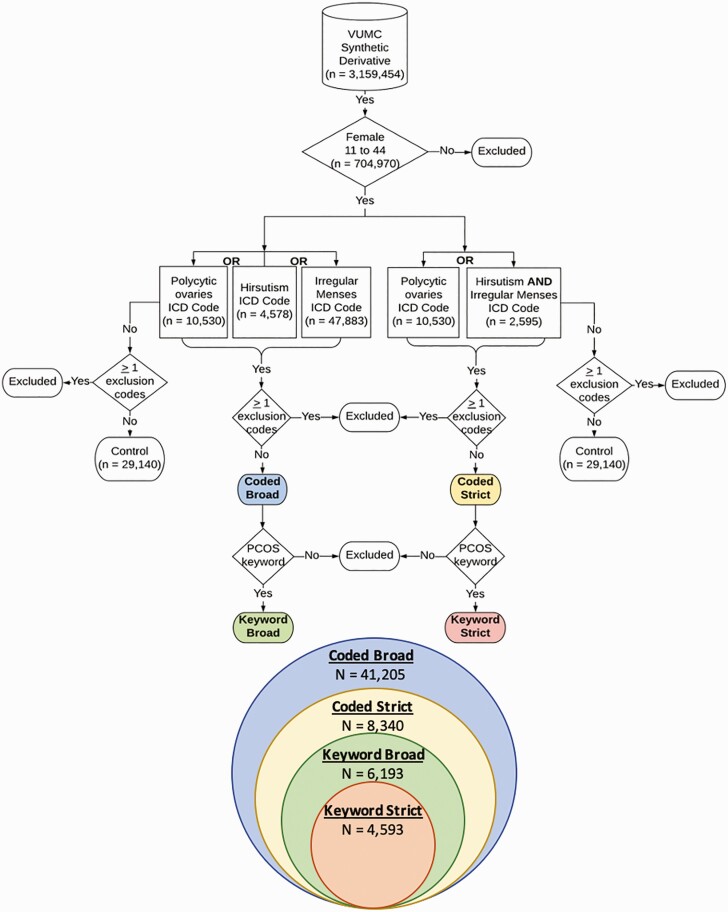
Figure 1.
Polycystic ovary syndrome (PCOS) algorithm pipeline. This schematic illustrates the algorithm development steps for the controls and the 4 PCOS algorithms. The Venn diagram illustrates how the algorithm data sets are nested within one another. Each color corresponds with one of the algorithm data sets. ICD, International Classification of Diseases, 9th and 10th revision.

