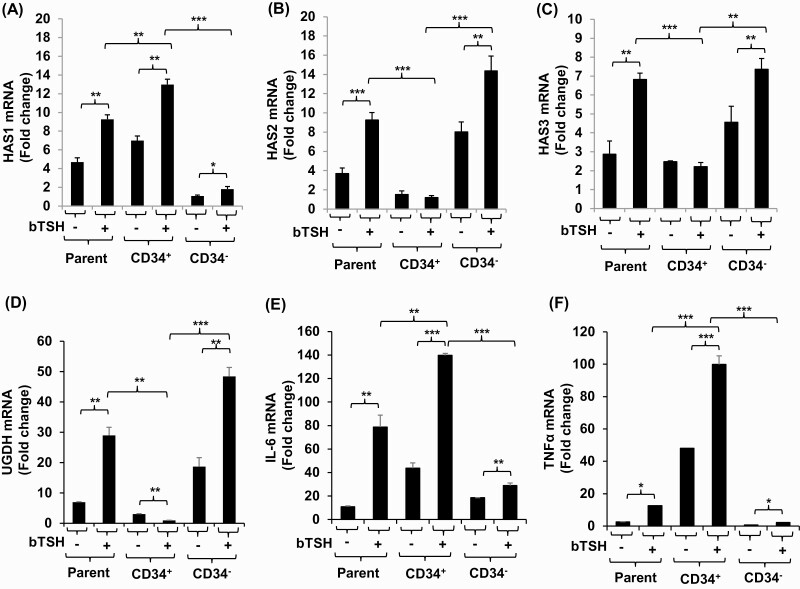
Figure 7.
Localization of HAS1, HAS2, HAS3, UGDH, IL-6, and TNF-α expression and induction by bTSH to CD34+ OF and CD34- OF subsets of GD-OF. GD-OF were sorted into pure CD34+ and CD34- cell populations as described in “Methods.” These were re-cultured for 48 hours, the final 6 hours in the absence or presence of bTSH (5 mIU/mL). RNA was extracted, reverse-transcribed, and subjected for quantitative RT-PCR for the target genes indicated. Transcript levels were normalized to their respective GAPDH signals. Data are expressed as mean ± SD of triplicate independent determinations from a single experiment representative of 3 conducted. * P < 0.05; ** P < 0.01; *** P < 0.001.

