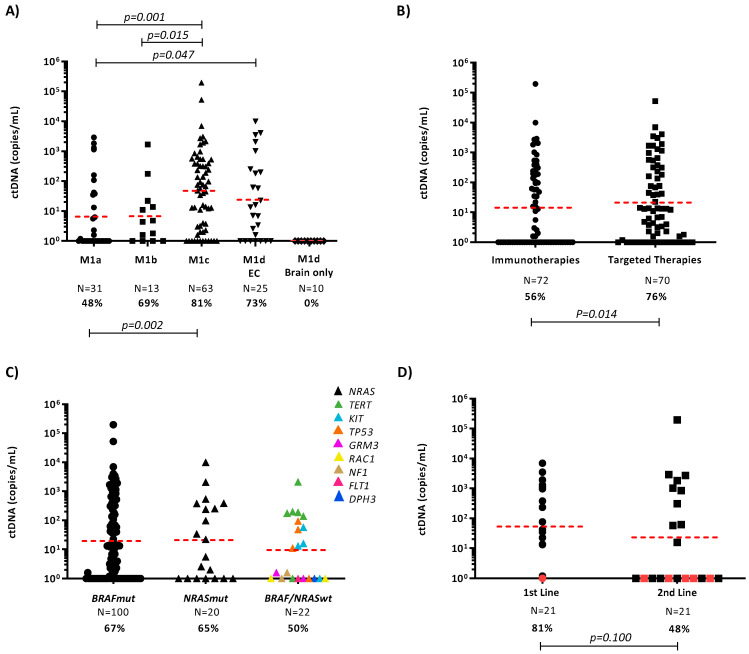
Figure 1.
ctDNA quantification in melanoma patients prior to commencing systemic therapy. (A) Plasma ctDNA levels (copies/mL of plasma) in melanoma samples (N = 144), stratified by M status. M1d cases were further subdivided into those with extracranial (EC) and those with brain only metastases. Percentages denote the frequency of patients with detectable ctDNA. The geometric mean of ctDNA concentrations is indicated for each group by a dashed red line. Unpaired t-test p-values of the log-transformed ctDNA levels are indicated. (B) Dot plot diagram showing ctDNA at baseline in patients treated with immunotherapy (IT) and targeted therapy (TT). (C) ctDNA detection in patients with BRAF, NRAS or BRAF/NRAS wild-type tumours commencing first-line treatment. (D) ctDNA detection at first-line and second-line treatment in BRAF mutant patients. Red dots represent patients with intracranial disease only at the time of starting therapy.

