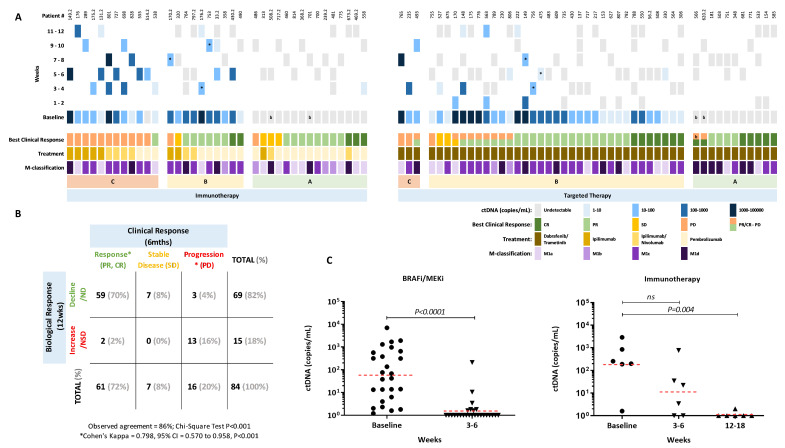
Figure 2.
ctDNA levels early during treatment relative to clinical response. (A) Columns represent each patient, best clinical response, treatment type and longitudinal quantitative ctDNA results. Patients treated with immunotherapy or targeted therapy were stratified into three profile groups: A = undetectable ctDNA at baseline and during treatment with a biological response, B = detectable ctDNA at baseline that became undetectable during treatment or had a significant biological response and C = detectable/undetectable ctDNA at baseline that remained or became detectable during therapy without significant biological response. * Significant Biological Response. b Presence of only intracranial malignant disease at baseline or at PD. (B) Concordance between best clinical response at 6 months and biological ctDNA response within the 12 weeks of treatment. Patients categorised as clinically responders (PR/CR, N = 61), patients with stable disease (SD, N = 7) and patients with disease progression (PD, N = 16) and, ctDNA responders (Group A and B; N = 69) or non-responders (Group C; N = 15) based on their biological ctDNA response over the first 12 weeks of treatment. Abbreviations: ND=Not detectable; NSD=Non-significant decrease. (C) Plasma ctDNA levels at baseline and follow-up in patients that responded to targeted therapy (N = 26) and to immunotherapy (N = 6). P-values of paired t-tests are indicated. The geometric mean ctDNA concentration is indicated for each group by a dashed red line.

