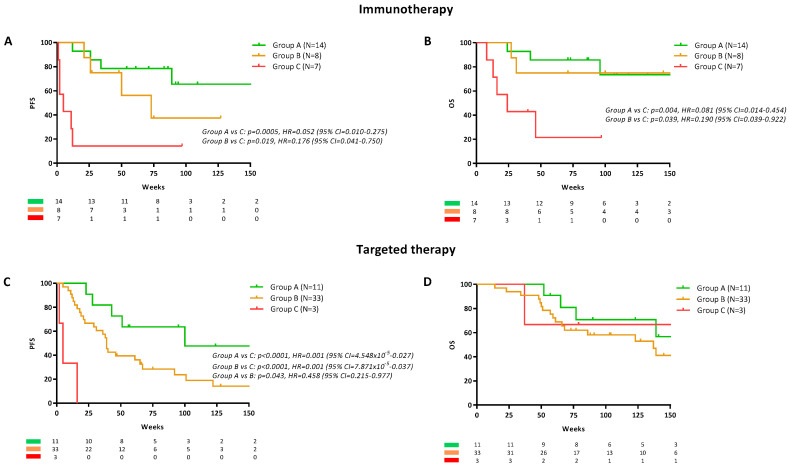
Figure 3.
ctDNA levels early during treatment relative to survival. Progression free survival (PFS) and overall survival (OS) curves for patients treated with (A,B) immunotherapy or targeted therapy (C,D) stratified into the three previously detailed profile groups A, B and C. Cox regression p-values, Hazard Ratio (HR) and 95% confidence intervals (CI) are indicated for each plot.

