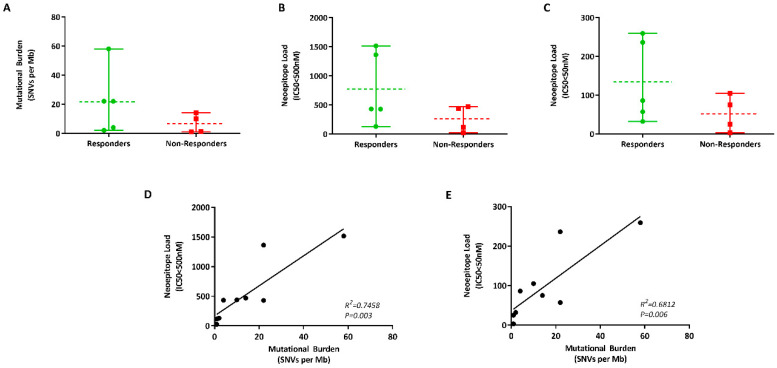
Figure 4.
ctDNA as a tumour source for mutational burden analysis. (A) Vertical scatter plot of the difference in the mutational burden (number of single-nucleotide variants (SNVs per Mb of DNA) in responders (green) and non-responders (red) to anti-PD-1 blockade. Graphs indicating the difference in the number of low—IC50 < 500 nM (B) and high—IC50 < 50 nM (C) affinity neoantigens in melanoma patients treated with immunotherapy. Correlation between the mutational burden and neoepitope loads at IC50 < 500 nM (D) and IC50 < 50 nM (E).

