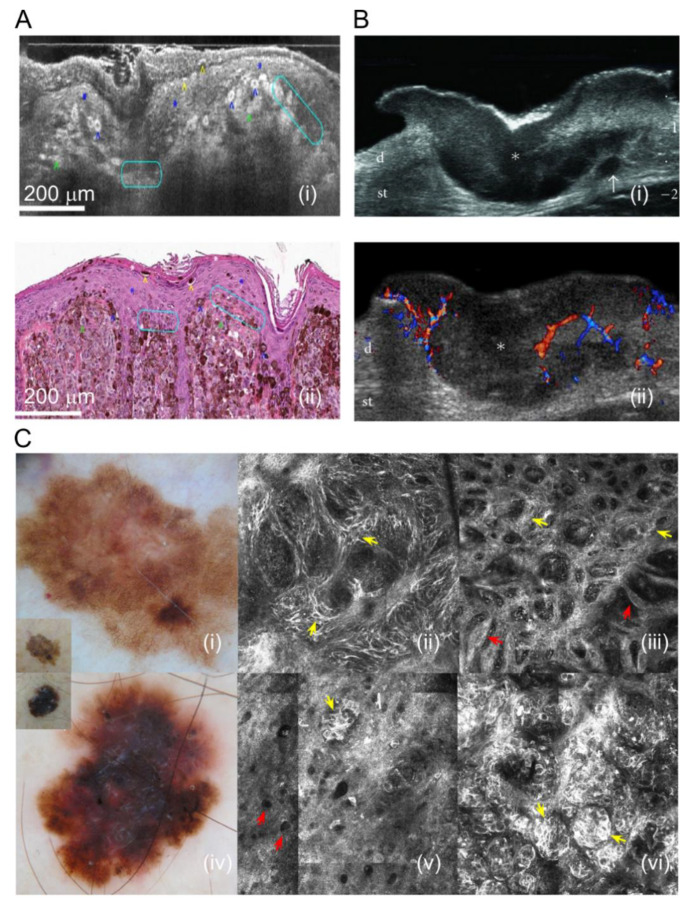
Figure 9.
Morphological melanoma features (A) (Reproduced from “Line field confocal optical coherence tomography for high-resolution noninvasive imaging of skin tumors”, doi:10.1117/1.Jbo.23.10.106007 by Dubois et al., published by SPIE, reproduced under Creative Commons Attribution 3.0 Unported License from [91], © The Authors). LC-OCT (Line field-optical coherence tomography) image of cutaneous melanoma (i) and a histopathology slide of the corresponding lesion (ii). Blue star: epidermis; white star: stratum corneum; blue arrowhead: pagetoid spread of tumor epithelial cells; yellow arrowhead: tumor cells being eliminated; green arrowhead: clumps of melanocytic tumor cells in the dermis; turquoise circles: partial DEJ (dermal–epidermal junction disruption) [91]. (B) (Reproduced from “Sonography of the primary cutaneous melanoma: a review” by Wortsman under the Creative Commons Attribution License [92]) Transverse ultrasound image (i) of melanoma on the abdominal wall demonstrating fusiform hypoechoic lesion (*) that is invading the dermis and subcutaneous tissue. The arrow is pointing to a satellite metastasis. Doppler ultrasound (ii) shows increased vasculature and blood flow. Abbreviations: d: dermis; st: subcutaneous tissue [92]. (C) (Reproduced from “Reflectance confocal microscopy features of BRAF V600E mutated thin melanomas detected by immunohistochemistry” by Urvanegia et al. under Creative Commons Attribution License from PLOS One, © 2020 Urvanegia [93]). Reflectance confocal microscopy images are demonstrated in panels (ii), (iii), (v), and (vi). (i) is a dermoscopy image of a superficial spreading melanoma with a broadened pigment network. (ii) (1.5 × 1.5 mm) illustrates singular atypical cells (yellow arrows) causing dermal–epidermal thickening. (iii) (1.5 × 1.5 mm) shows a meshwork pattern (red arrows), thick interpapillary spaces (yellow arrows), and nonedged papillae at the dermal–epidermal junction. (iv) is a dermoscopy image of superficial spreading melanoma with a multicomponent pattern. (v) (0.75 × 0.75 mm) shows epidermal nests and hyporeflective pagetoid cells in the epidermis (red arrows). (vi) (0.75 × 0.75 mm) demonstrates dermal–epidermal nests (yellow arrows) [93].

