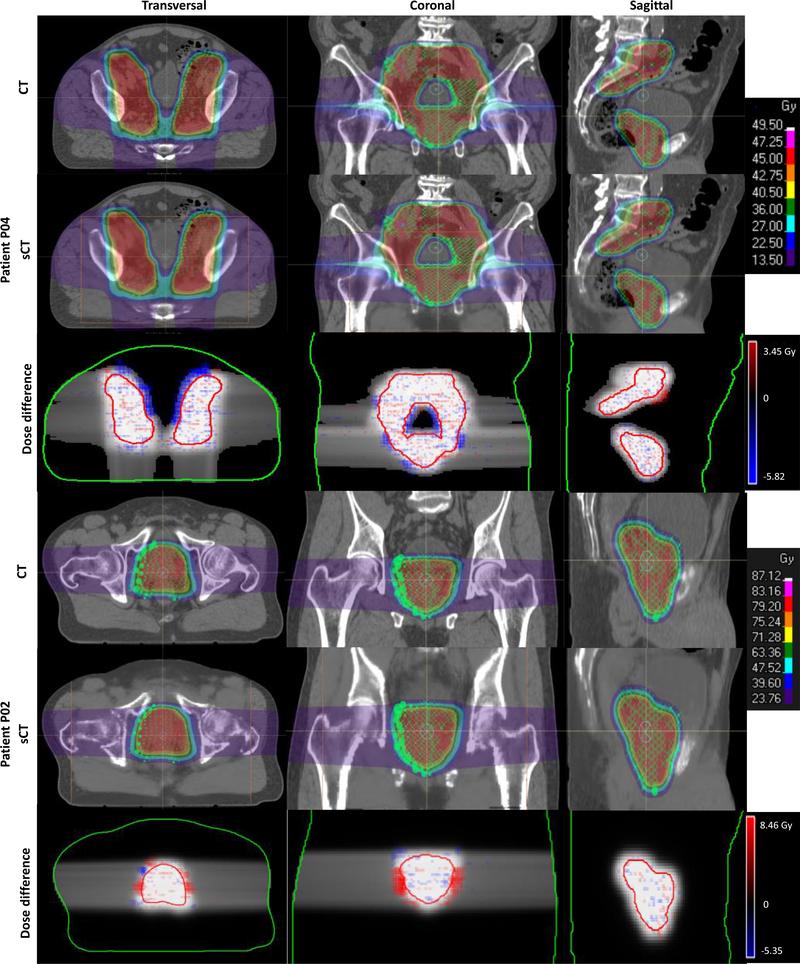
Figure 5.
From left to right: transverse, coronal and sagittal views. Two representative patients were used to demonstrate the dose differences between plans calculated on original CT and sCT. The dose profiles were retrieved from the three different views that intersect with the isocenter. The individual spot Bragg peak location (green ‘O’ or ‘×’ markers, different marks were used in TPS to present different spot weighting) were included in the dose map. The MRI FOV was marked with orange lines. In the dose difference map, the body (in green line) and PTV contours (in red line) together with the reference dose (grey scaled CT-based dose map) as background were added to represent the location of dose discrepancy.

