
Figure 4.
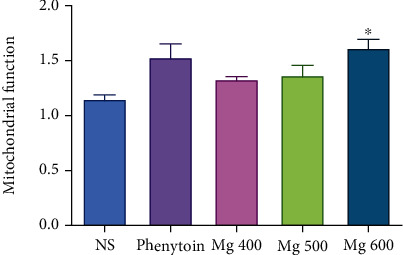
Effect of different doses of MgSO4 and phenytoin on mitochondrial function after induced hypoxia by the asphyctic method. Values represented as mean ± SD (n = 8). ∗P < 0.05 compared with the control group (NS).
Official websites use .gov
A
.gov website belongs to an official
government organization in the United States.
Secure .gov websites use HTTPS
A lock (
) or https:// means you've safely
connected to the .gov website. Share sensitive
information only on official, secure websites.
Effect of different doses of MgSO4 and phenytoin on mitochondrial function after induced hypoxia by the asphyctic method. Values represented as mean ± SD (n = 8). ∗P < 0.05 compared with the control group (NS).