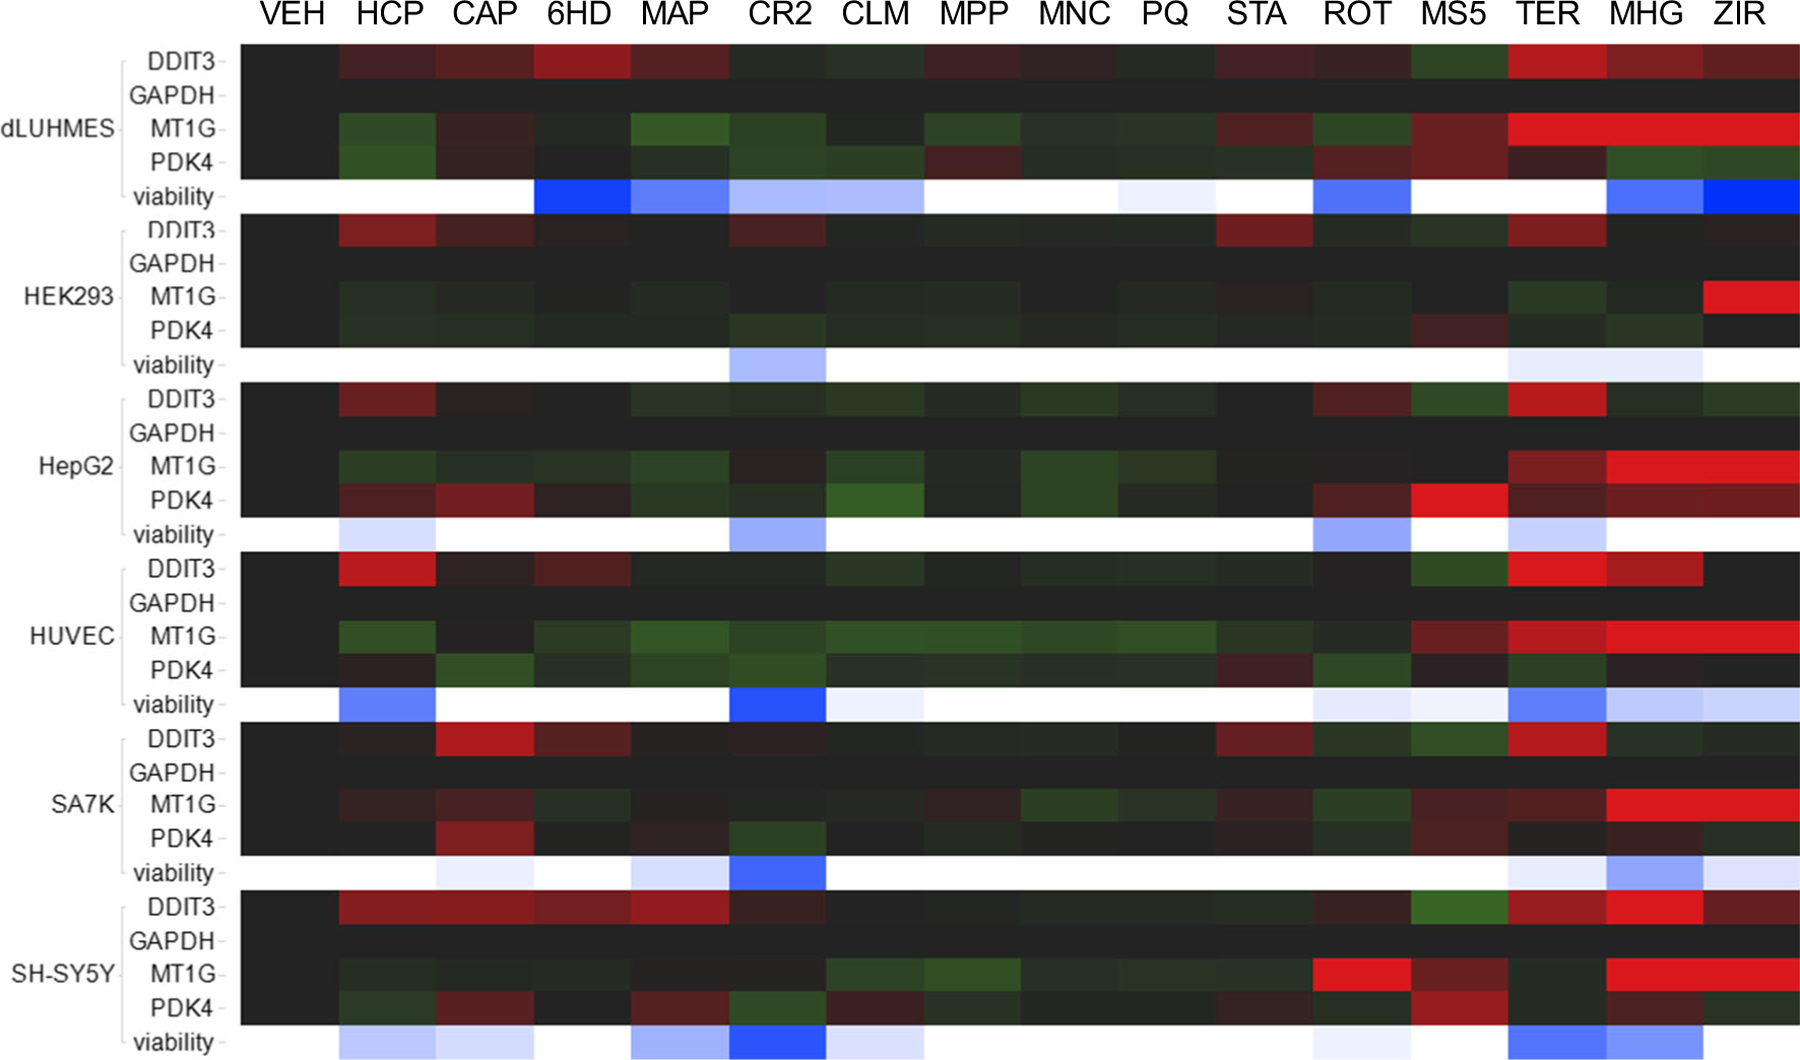
Fig. 2.

Transcriptional responses of three biomarker genes to 15 toxicants in six cell lines. The six cell lines indicated at left were treated with vehicle or one of 15 toxicants. Transcriptional responses by DDIT3, MT1G, PDK4, and GAPDH were quantified by qRT-PCR at 6 h, and cell viability was assessed at 24 h as intracellular [ATP]. Below the four genes for each cell line is a row of cells that indicate cell viability. White indicates no detectable loss of viability whereas blue color saturation indicates the % of cell death 24 h post-treatment. Toxicant treatments were HCP, Hexachlorophene 10 μM; CAP, captan 10 μM; 6HD, 6-hydroxydopamine 3 μM; MAP, 4-(methylamino)phenol hemisulfate salt 5 μM; CR2, sodium dichromate 5 μM; CLM, chlorambucil 10 μM; MPP, 1-methyl-4-phenylpyridinium 10 μM; MNC, manganese chloride 10 μM; PQ, paraquat 10 μM; STA, staurosporine 2 μM; ROT, rotenone 3 μM; MS5, MS275 10 μM; TER, terfenadine 10 μM; MHG, methylmercury chloride 2 μM; ZIR, ziram, 6 μM
