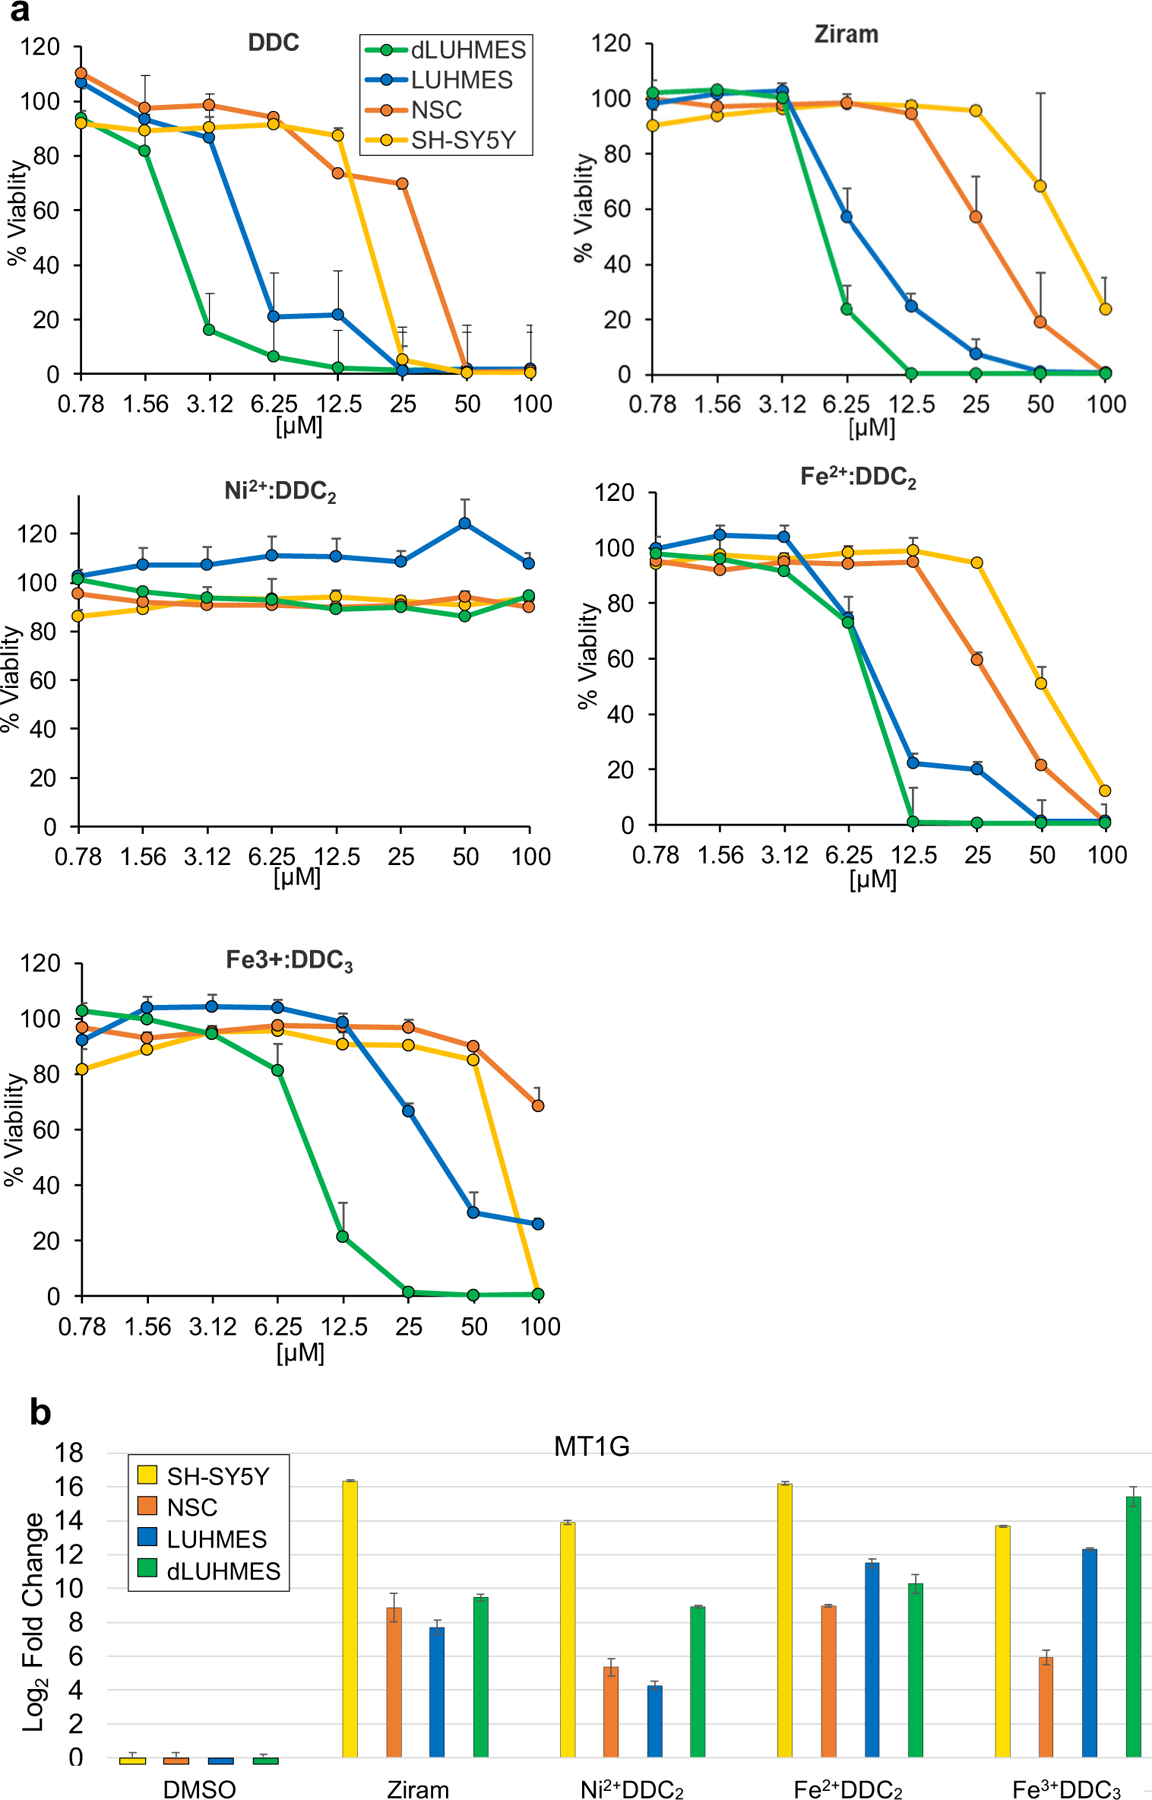
Fig. 3.

Metal chelates cytotoxicity to neural cell lines and MT1G induction. a. Each cell line was treated for 24 h and % viability was measured as intracellular [ATP] relative to the vehicle-treated control. b. Cells were treated with 5 μM each chemical for 6 h, and MT1G transcripts were quantified by qRT-PCR in the indicated cell types and expressed as Log2 fold change relative to the vehicle-treated control
