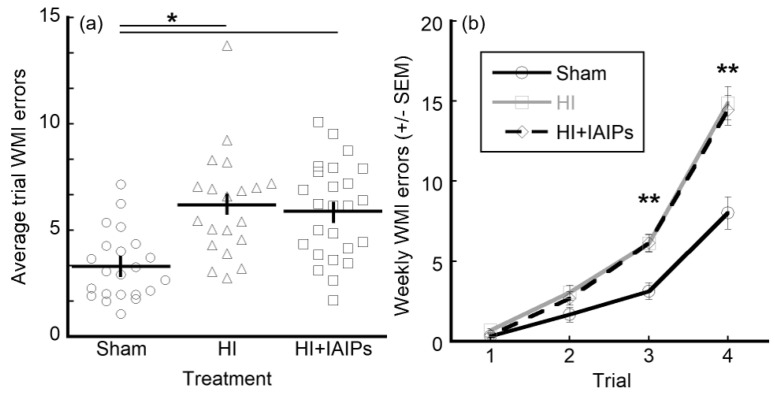
Figure 3.
Treatment effects on WMI errors (±SEM), a moderate cognitive demand task component. Total n = 67, Sham (22), HI (20), HI + IAIPs (25). Horizontal bars indicate mean and vertical error bars represent SEM. ANOVA and post-hoc tests indicate both HI and HI + IAIPs treatment groups performed worse than Shams in overall WMI errors across all trials and weeks (a) * indicate significant differences by Tukey’s homologous subsets and (b) ** indicates both HI and HI + IAIPs performed significantly worse than Sham in later trials of the maze protocol over all weeks by paired comparison with Sidak correction.

