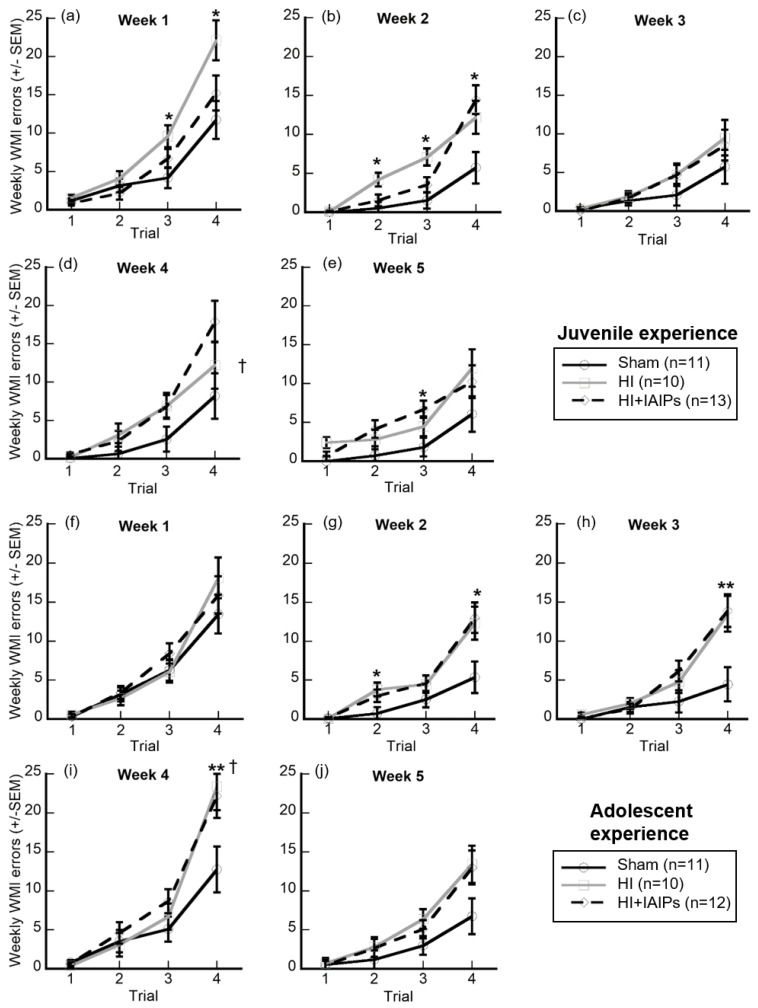
Figure 5.
Expanded representation of WMI error performance (±SEM) on individual trials collapsed across weeks. Top two rows (a–e): juvenile first RWM experience starting at P31. Total n = 34, Sham (11), HI (10), HI + IAIPs (13). Bottom two rows (f–j): adolescent first RWM experience starting at P52. Total n = 33, Sham (11), HI (10), HI + IAIPs (12). Each plot is aligned by that experience group’s number of weeks of experience. A three-week break occurs between Week 3 and Week 4 for both experience groups. Paired comparisons were made between both treatments within each graph and between experience groups at the same relative trial, for example, Figure 5a,f. * indicates a trial where one injured treatment group, either HI or HI + IAIPs, performed significantly worse than Sham. ** indicates a trial where both HI and HI+IAIP treatment groups performed worse than Sham. † indicates a trial where the HI-treated, juvenile experience cohort (d) significantly differs from the HI-treated, adolescent experience cohort (i). All corrected by Sidak correction for multiple comparisons.

