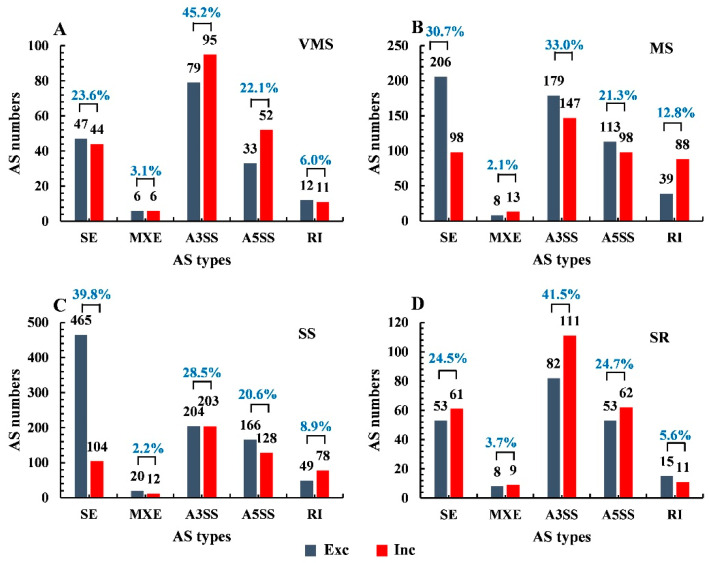
Figure 2.
Comparison of the number and proportions of differential AS events under various drought conditions. (A) Under VMS condition, (B) under MS condition, (C) under SS condition, and (D) under SR condition. Exclusion is shown in blue, and inclusion is shown in red. The y-axis shows the number of AS events. The x-axis shows the types of AS.

