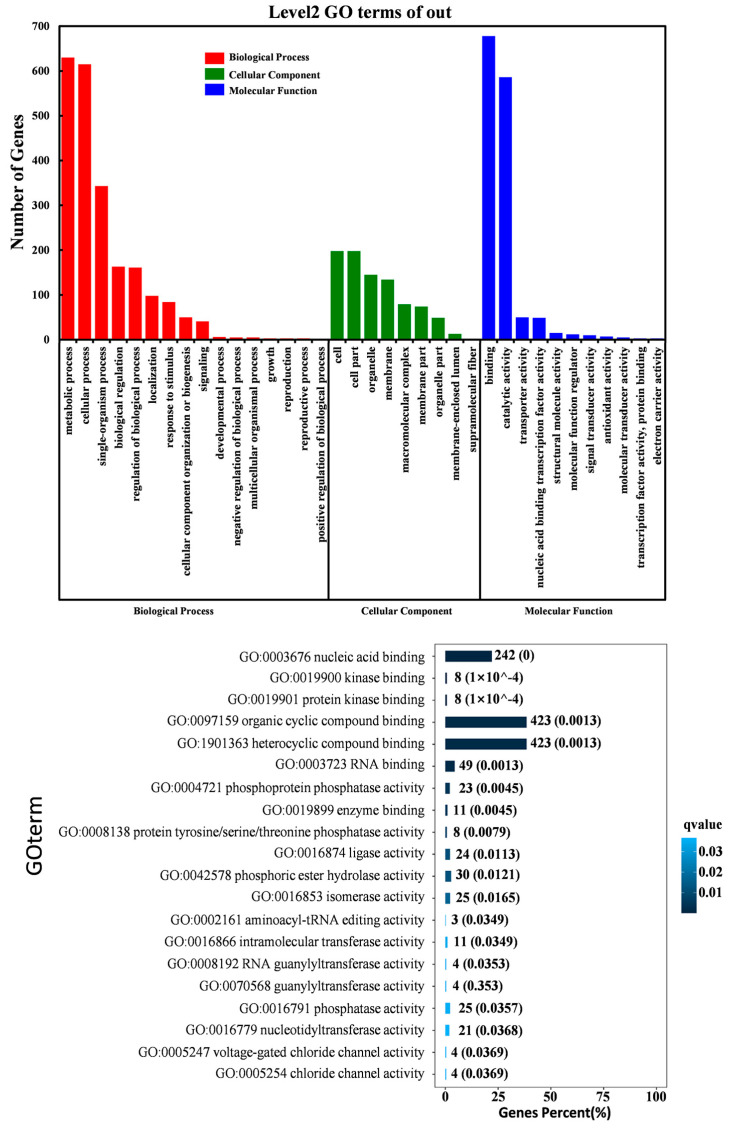
Figure 5.
Representation of the Gene Ontology (GO) classification for biological process, molecular function, and cellular component. (A) GO terms assigned to DSGs under various drought conditions (false discovery rate (FDR) value < 0.05). (B) The top 20 GO enrichment terms (molecular function) of DSGs under various drought conditions. Notes: the blue bar chart represents the gene percentage (%) of the GO terms.

