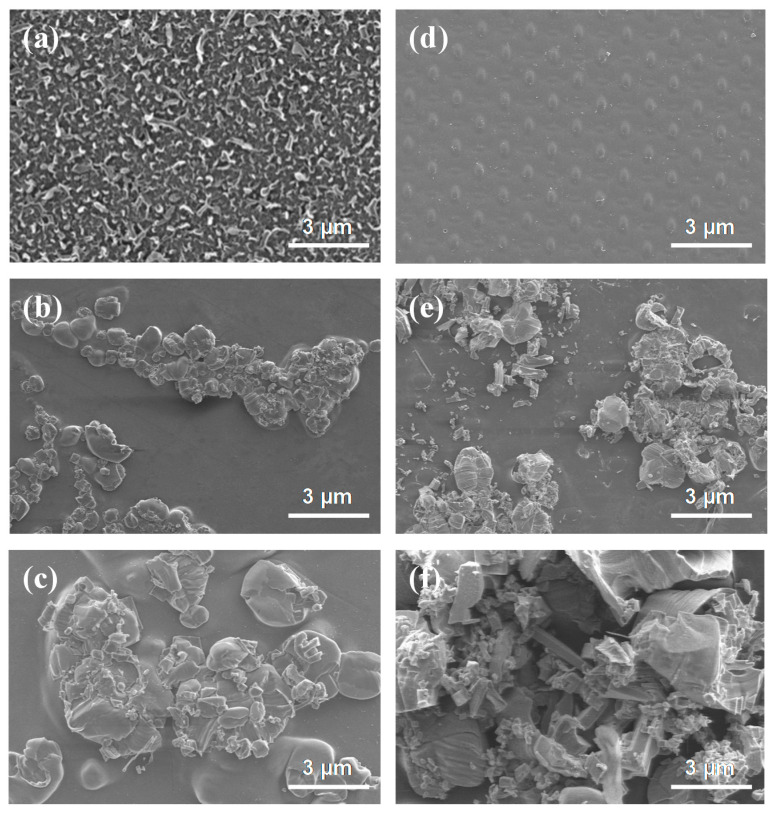
Figure 9.
SEM images of the (a) active layer of pristine membrane, (d) support layer of pristine membrane, (b,c) active layer of fouled membrane, and (e,f) support layer of the fouled membrane. The fouled membrane was produced after 24 h experiment. FO process (in AL-FS mode); Flow rate: 300 mL/min; Temperature: 36.5 ± 0.5 °C.

