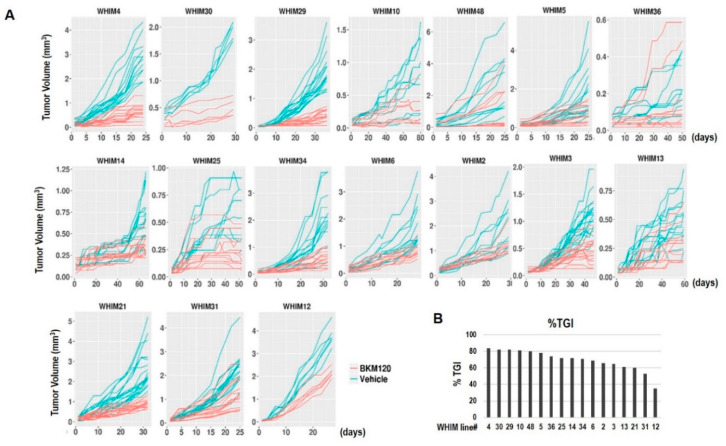
Figure 2.
PDX tumor growth response to BKM120. Panel (A) shows tumor volume changes of individual PDX models over time in response to treatment with either vehicle or BKM120 30 mg/kg orally days 1–5 each week. Each line represents a single tumor. Panel (B) shows the bar graph of the percentage tumor growth inhibition (%TGI) at the completion of the experiments for each PDX model.

