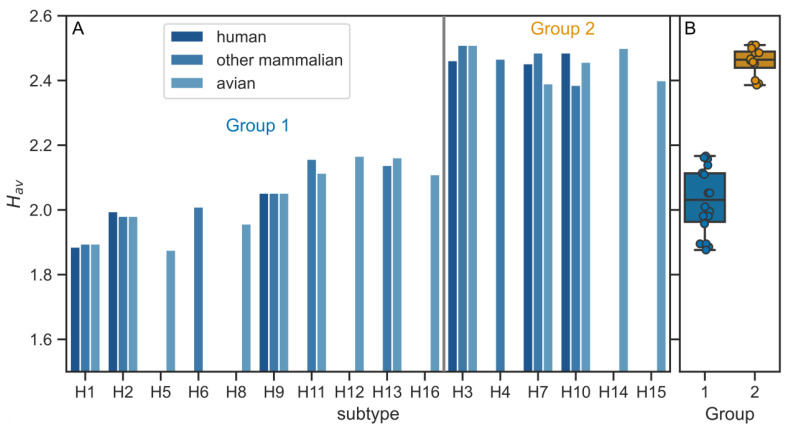
Figure 2.
(A) Average hydrophobicity (Hav) values for individual HA TMD sequences according to the subtype and host. (B) Average Hav values for the subtypes belonging to the two phylogenetic groups. The difference between groups 1 and 2 is statistically significant (p < 10−5, two-sided Mann–Whitney U test).

