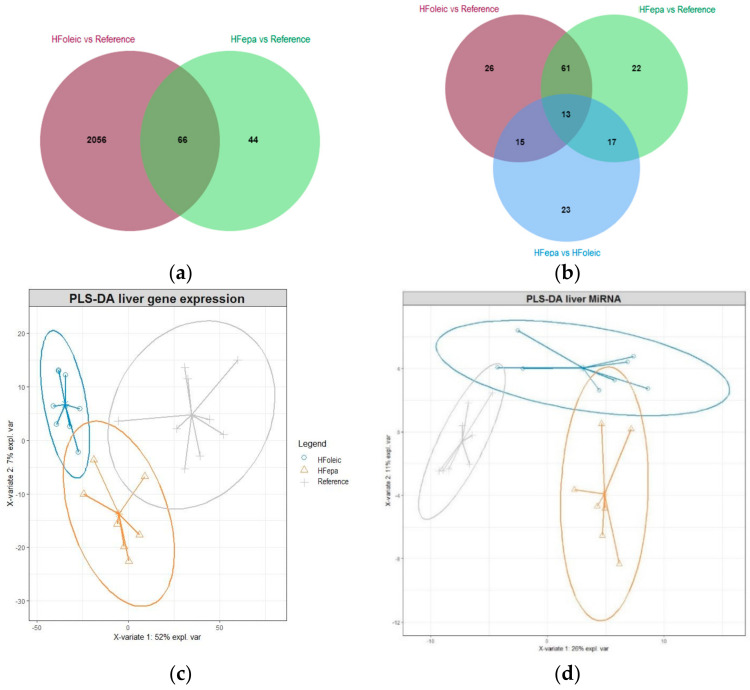
Figure 2.
Effect of High Fat Diet and transgenerational supplementation with EPA in gene and miRNAs expression. (a) Venn diagram showing the relationships in the number of genes differentially expressed between HFepa vs. reference and HFoleic vs. reference biological condition. (b) Venn diagram showing the relationships in the number of miRNAs differentially expressed between three biological conditions, HFepa vs. reference, HFoleic vs. reference and HFepa vs. HFoleic. (c) Differentially expressed genes from three group biological condition, HFepa vs. reference, HFoleic vs. reference, HFepa vs. HFoleic were used to perform a partial least squares regression-discriminant analysis (PLS-DA). (d) PLS-DA analysis of differentially expressed miRNAs from three biological conditions, HFepa vs. reference, HFoleic vs. reference, HFepa vs. HFoleic.

