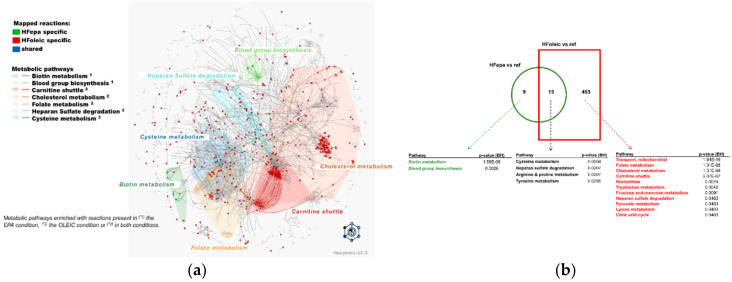
Figure 4.
Connections between regulated metabolic pathways in HFoleic and HFepa goups. Genes differentially expressed from HFepa vs. reference and HFoleic vs. reference biological conditions were used to identify related metabolic reactions in MetExplore allowing a complementary exploration of enriched metabolic pathways. Metabolic reactions associated with modulated genes in both HFepa and HFoleic conditions were mapped in the Mus musculus metabolic network. (a) The Figure shows a global network of mapped metabolic reactions. Reactions in red are HFoleic-related; reactions in green are HFepa-related; blue reactions are both regulated in HFoleic and HFepa groups. Represented metabolic pathways correspond to metabolic pathways enriched with reactions present in the EPA condition (1), in the oleic condition (2) or in both conditions (3). (b) Representation of the number of identified reactions and the significantly enriched related metabolic pathways according to the MetExplore analysis in the two comparisons that exhibited significant differential gene expression (HFoleic vs. reference and HFepa vs. reference).

