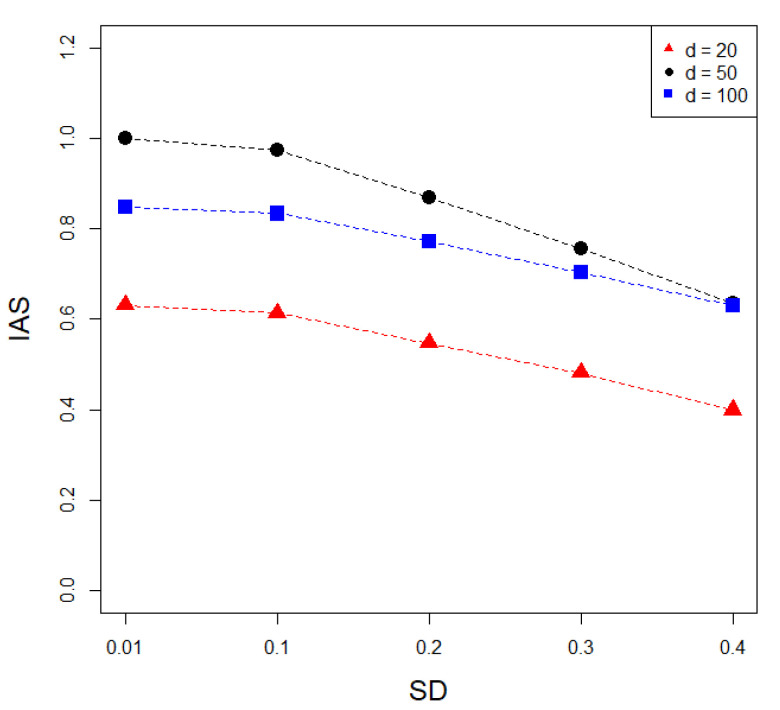
Figure 2.
Results of simulation study for measuring similarity between copy number alterations (CNAs) and gene expressions (GEs). The red, black and blue dots and lines indicate the numbers of variables in the gene expression matrix, as 20, 50, and 100, respectively. As standard deviations (SDs) increase, the mean IASs decline.

