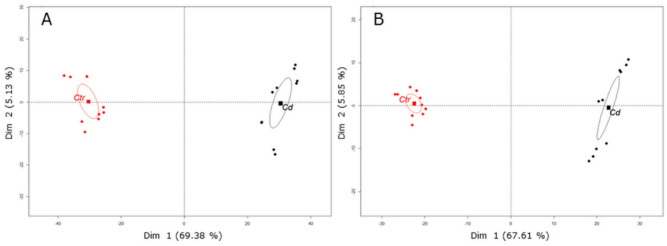
Figure 1.
Plots of PCA revealed differences of the secondary metabolite profiles in M. sativa stems after long-term Cd exposure (10 mg kg−1 soil dry weight). Results show two distinct clusters of Cd-exposed (Cd) stem samples and control (Ctr) stem samples. Metabolites were measured by UPLC–MS in two technical replicates from five biological replicates. When samples were analyzed in (A) negative mode, Dim 1 and Dim 2 represent together 74.51% of the observed variance in the sample set. (B) In positive mode, Dim 1 and Dim 2 represent together 73.46% of the observed variance in the sample set. The barycenter of samples from control and Cd-exposed plants is indicated with a square.

