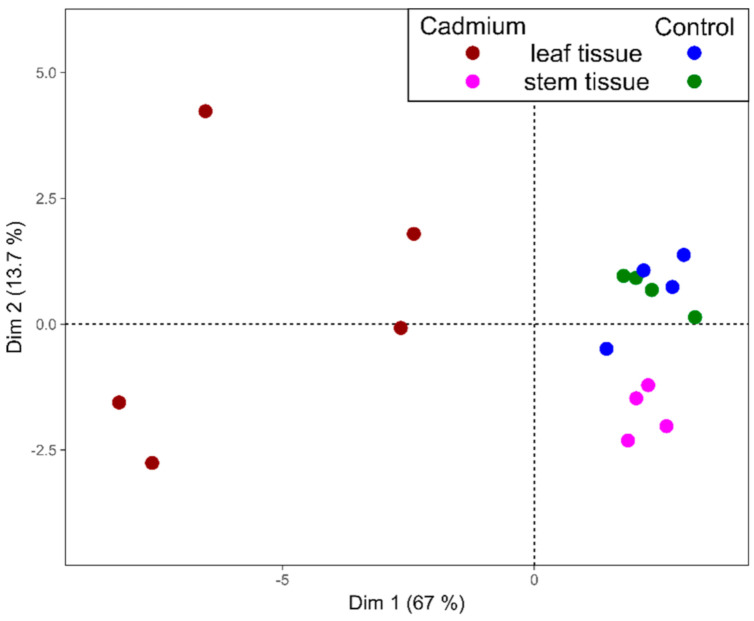
Figure 4.
Principal component analysis demonstrates differentiation between the leaves and stems of M. sativa after long-term Cd exposure based on their AA profile, based on values normalized to the average of the non-exposed control for each organ separately. Dim 1 captures 67% of the variance, and Dim 2 captures 13.7% of the variance.

