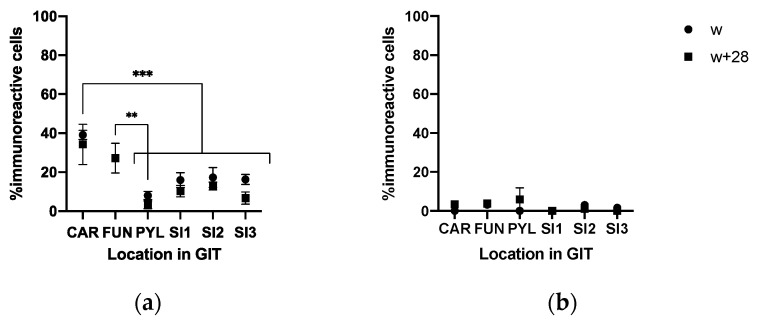
Figure 8.
(a) %TRPV1-IR cells and (b) %TRPA1-IR cells that did not colocalize on CgA-IR cells (CAR: cardia, FUN: fundus, PYL: pylorus, SI1; SI2; SI3: resp. 2.5%, 25%, 75% of total SI length) at weaning (w) and 28 days post-weaning (w + 28). Significant differences between regions are indicated with asterisks: ** p < 0.01; *** p < 0.001, pooling the two time points. Number of replicates per treatment was n = 6. Error bars express the SEM.

